Indicatore
Media mobile esponenziale (EMA)

Fracture Threshold Strategy [JOAT]Fracture Threshold Strategy
Introduction
Fracture Threshold Strategy (FTS) is an open-source, automated Pine Script v6 trading strategy that combines three independent filters — a seven-condition MasterTrend EMA alignment score, a relative volume regime gate, and a session time restriction — into a single, unified entry system. Entry is triggered by an EMA 4/5 crossover when all three filters are simultaneously satisfied. Stop loss is placed at 1.5× ATR from entry. Take profit is set at a 3:1 reward-to-risk ratio by default. All orders are executed on bar close (process_orders_on_close=false), and signals are gated on barstate.isconfirmed to eliminate intrabar repainting.
FTS is designed to demonstrate how institutional-grade filtering layers can be combined into a programmatic strategy with realistic, auditable results. It is not a black box — every condition is visible in the dashboard and the source code is fully open. The strategy description explains the exact logic, the default backtesting parameters, and the limitations of any backtesting approach.
Core Concepts
1. MasterTrend Seven-EMA Alignment Score
Seven trend conditions are evaluated on each bar. Each satisfied condition contributes one point to a bull or bear score (0–7):
EMA 4 above/below EMA 5 — fast momentum direction
RSI above/below 50 — momentum confirmation
Price above/below EMA 21 — short-term trend
EMA 21 above/below SMA 50 — medium-term structure
SMA 50 above/below EMA 55 — medium-to-intermediate trend
EMA 55 above/below EMA 89 — intermediate trend
Price above/below EMA 750 — long-term macro trend
Entry requires the bull or bear score to equal or exceed the configurable minimum (default: 5 out of 7). This prevents entries during low-conviction, mixed-alignment market conditions.
2. Relative Volume Regime Gate
Volume regime is measured as the ratio of a short-term volume MA to a long-term volume MA, smoothed by an EMA:
float volRatio = ta.ema(volShort / math.max(volLong, 1.0), i_volSmth)
bool volOK = volRatio >= i_volMin
The default minimum ratio is 0.90 — entries are blocked when recent volume is more than 10% below the long-term average. This prevents the strategy from entering trades during dead, low-participation conditions where institutional order flow is absent.
3. Session Filter
Trading is restricted to the London session (08:00–17:00) and New York session (14:00–21:00) in the selected timezone, with both independently toggleable. Entries outside the active sessions are blocked. This keeps the strategy focused on the highest-liquidity periods of the trading day.
4. EMA 4/5 Crossover Entry Trigger
The entry trigger is an EMA 4 crossover above EMA 5 (for longs) or crossunder (for shorts), evaluated on confirmed bar closes. The crossover is a fast momentum signal — it fires at the beginning of a new short-term directional move. Combined with the full filter stack, it identifies the specific bar where momentum begins aligning with the broader structural trend.
5. ATR Stop Loss and 3:1 Take Profit
Stop loss is placed at 1.5× ATR from entry. Take profit is placed at 3× the stop distance (configurable). Both levels are computed at entry and fixed — they do not trail. The strategy uses Pine Script's strategy.exit() function with explicit stop and limit prices for clean, non-discretionary execution.
Default Backtesting Properties
The strategy has been published with the following default Properties settings. These values are used in all performance metrics shown on the chart:
Initial Capital: $10,000 (realistic for an individual trader)
Position Size: 2% of equity per trade (risk-managed sizing)
Commission: 0.05% per side (representative of standard exchange or broker fees)
Slippage: 2 ticks
Pyramiding: 0 (one trade open at a time)
process_orders_on_close: false (orders execute on the next bar open, not at the signal bar close)
Using 2% of equity per trade with a 1.5× ATR stop means the maximum percentage of equity at risk per trade scales with position size dynamically — at a 3:1 RR ratio, three losing trades in a row lose approximately 6% of equity, which is within the TradingView recommended range. A dataset that generates at least 100 trades is recommended for meaningful statistical evaluation. On lower timeframes (5m, 15m) on major equity indices or forex pairs with London and NY sessions active, the default settings typically produce sufficient trade counts.
Features
Three-Layer Entry Filter: MasterTrend score, volume regime, and session — all three must be satisfied simultaneously
Configurable Minimum Score: Adjustable minimum MasterTrend alignment score threshold (1–7, default: 5)
EMA 4/5 Crossover Trigger: Fast momentum crossover as entry signal within aligned conditions
ATR Stop Loss: Dynamic stop placement based on current ATR — adapts to instrument volatility
Fixed Ratio Take Profit: 3:1 default reward-to-risk — adjustable
Session Restriction: London and New York sessions independently configurable with timezone setting
Volume Regime Gate: Minimum volume ratio filter blocks entries during low-participation conditions
TP/SL Visualization: Active trade TP and SL boxes drawn from entry and extended on each bar — color changes on outcome
Entry Markers: Triangle plotshapes at long and short entry bars for clear chart identification
EMA Reference Plots: EMA 4, EMA 5, EMA 21, and EMA 750 plotted as reference
Non-Repainting: process_orders_on_close=false; all entry conditions gated on barstate.isconfirmed
Dashboard (Top Right): Live MasterTrend state, volume regime, session, current position, net P&L, win rate, profit factor, max drawdown, average win/loss, and RR ratio
Entry Context Labels: Each entry label now shows the MasterTrend score and volume regime tag at the moment of entry in the format "L 6/7 | V:HI" — full entry context visible on the chart without needing to consult the dashboard
Position Candle Tint: Candles colored green while a long position is open, red while a short position is open — provides an immediate visual record of all trade durations across the full chart history
Per-Session Performance Breakdown: London and New York win rates tracked and displayed separately in the dashboard — identifies which session produces the strongest historical edge for the current instrument and timeframe
Expanded Dashboard (15 Rows): Dashboard expanded to 15 rows — now includes a full session performance section with London and NY win rates alongside the existing strategy performance metrics
Input Parameters
MasterTrend EMA Stack:
EMA 4, EMA 5, EMA 21, SMA 50, EMA 55, EMA 89, EMA 750: All periods individually configurable
RSI Length: RSI period for momentum condition (default: 14)
Volume Regime Filter:
Short Vol MA / Long Vol MA: Volume baseline calculation periods (default: 10, 40)
Vol Smooth: EMA smoothing for ratio (default: 3)
Min Vol Ratio: Minimum ratio threshold for entry permission (default: 0.90)
Session Filter:
Timezone: Session evaluation timezone (default: America/New_York)
Session Filter: Master toggle (default: enabled)
Allow London / Allow NY: Independent session toggles (both default: enabled)
Entry Trigger:
EMA4/5 Cross Entry: Use crossover as trigger (default: enabled)
Min MasterTrend Score: Minimum score required for entry (default: 5)
Risk Management:
ATR Length: ATR period (default: 14)
ATR SL Multiplier: Stop distance as ATR multiple (default: 1.5)
Reward:Risk Ratio: TP multiple (default: 3.0)
How to Use This Strategy
Step 1: Verify the Filter Stack is Active
The dashboard shows MasterTrend state, volume regime, and current session at all times. Before a trade can occur, all three must be aligned — a bull score ≥ 5, volume ratio ≥ 0.90, and an active London or NY session window.
Step 2: Observe the EMA 4/5 Crossover
The entry trigger is the EMA 4 crossing EMA 5. With all filters active, the next crossover in the trend direction will generate an entry. The entry is executed at the open of the following bar (process_orders_on_close=false), which is the realistic execution point.
Step 3: Manage the Open Trade
The TP/SL boxes extend from the entry bar and update on each subsequent bar. The strategy's exit function manages the trade automatically — no manual management is required. The dashboard shows the current position state (LONG / SHORT / FLAT) at all times.
Step 4: Evaluate Backtesting Results Critically
Past results do not predict future performance. Before drawing conclusions from any backtest, ensure the trade count is at least 100. A small sample (under 50 trades) produces unreliable win rate and profit factor estimates. Test across multiple instruments and timeframes — a strategy that performs well on one asset in one period may not generalize.
Strategy Limitations
The EMA 750 requires 750 bars of chart history. On timeframes or instruments with limited bar history, the 750-period EMA will be inaccurate for the first 750 bars — backtest results including those bars should be discounted
Backtesting does not account for liquidity, market impact, or partial fills on real orders. The 2-tick slippage setting is an approximation — on illiquid instruments or during news events, actual slippage may be significantly higher
The EMA 4/5 crossover is a fast signal. In choppy, sideways markets where EMAs cross frequently, the strategy may enter multiple trades quickly that all exit at stop loss before the filter stack re-assesses. The session and volume filters reduce but do not eliminate this behavior
A fixed 3:1 RR ratio requires the market to travel 3× the initial risk without reversing. On short timeframes or on instruments with narrow average ranges relative to ATR, achieving the full TP target may be less frequent than on smoother-trending assets
Commissions, taxes, and regulatory fees vary by broker, instrument, and jurisdiction. The 0.05% commission default is a general estimate — actual trading costs should be substituted with broker-specific values before drawing performance conclusions
This strategy is one specific configuration of the underlying filter system. Adjusting the minimum MasterTrend score, volume threshold, session windows, or RR ratio will produce different results. Any configuration change constitutes a separate strategy with its own performance characteristics
Originality Statement
FTS implements a programmatic entry system by combining a seven-condition quantitative trend score, a relative volume regime gate, and a session time restriction into a unified, fully transparent open-source strategy. This is original for the following reasons:
The MasterTrend alignment score functions as a structural quality gate — rather than entering on any EMA crossover, the strategy explicitly requires a minimum number of the seven structural conditions to be simultaneously satisfied, producing a much stricter entry criterion than a standard crossover system
The volume regime gate uses a normalized ratio (not a raw volume level) to block entries during low-participation conditions — making the filter relevant across instruments and timeframes without requiring instrument-specific volume threshold calibration
The combination of structural alignment (EMA stack), activity quality (volume regime), and time context (session filter) as three independent prerequisites creates a compounding selectivity effect — the strategy only enters the specific intersection of all three conditions, which is a smaller, higher-conviction subset than any single filter alone
The live dashboard displaying all filter states, position context, and key performance metrics simultaneously provides full transparency into why any given bar does or does not produce a signal, making the strategy auditable in real time
Disclaimer
This strategy is provided for educational and informational purposes only. It is not financial advice or a recommendation to buy or sell any financial instrument. Trading involves substantial risk of loss. Backtesting results shown are based on historical data and do not guarantee or predict future performance. Past results are not indicative of future results. Commission and slippage values used in backtesting are estimates — actual trading costs will vary. The strategy does not account for all real-world execution factors. Always use proper risk management and consult a qualified financial professional before making trading decisions. The author is not responsible for any trading losses resulting from the use of this strategy.
-Made with passion by jackofalltrades
Strategia

MACD + 200 EMA + Support/Resistance Strategy This open-source strategy is an educational Pine Script implementation of a MACD + 200 EMA + support/resistance trading concept.
It was created to convert a visually explained strategy idea into clear, testable rules, so traders can study how the logic behaves under backtesting conditions.
The strategy combines three main components:
1. MACD momentum logic
2. A 200 EMA trend filter
3. A pivot-based support and resistance filter
For long setups, the strategy looks for a bullish MACD crossover below the zero line, while price is above the 200 EMA.
For short setups, the strategy looks for a bearish MACD crossover above the zero line, while price is below the 200 EMA.
A support and resistance filter can also be enabled. This filter uses confirmed pivot levels, wick-based touches, ATR-based tolerance, and a maximum level age to create a more objective interpretation of support and resistance behavior.
Main features:
- MACD default settings
- 200 EMA trend filter
- Optional pivot-based support and resistance filter
- Confirmed pivots only
- Wick-based touch detection
- ATR-based tolerance
- Long and short logic
- Multiple stop-loss modes
- Risk/reward based take-profit logic
- Optional pyramiding controls
- Strategy backtesting support
Stop-loss logic:
The script includes more than one stop-loss interpretation because the original concept does not define the stop placement with full precision.
Stop option 1:
A stop placed above or below the 200 EMA by a user-defined number of ticks.
Stop option 2:
A stop placed at the nearest valid swing within a user-defined lookback window. If no valid swing is found, the script falls back to the EMA-based stop.
Take-profit logic:
The take-profit target is calculated using a fixed risk/reward multiple based on the distance between entry and stop-loss.
Default risk/reward:
1.5R
Execution assumptions:
- Entries are placed on the next candle open after the signal bar.
- Exits are handled through stop-loss and take-profit only.
- MACD is calculated on close.
- EMA is calculated on close.
- Support and resistance levels are based on confirmed pivots only.
- The strategy is designed for educational backtesting and research, not for automatic live trading.
Important backtesting notes:
Backtest results can vary significantly depending on the symbol, timeframe, commission, slippage, spread, data provider, and strategy settings.
Users should always adjust commission and slippage settings to match the market being tested. A zero-cost setup may produce unrealistic results.
This script does not guarantee profitability, future performance, or a specific win rate.
This is not the original creator’s code. It is a testable logical interpretation of the strategy idea, built by converting unclear visual rules into explicit Pine Script conditions.
If you believe a different interpretation of the unclear parts would be more accurate, you can modify the open-source code and test your own version.
Disclaimer:
This script is provided for educational and research purposes only. It is not financial advice, investment advice, or a recommendation to buy, sell, short, or trade any asset.
Trading involves risk. Past performance and backtested results do not guarantee future results. Always do your own research and test thoroughly before using any strategy in live market conditions.
No strategy, indicator, or backtest can guarantee profits or eliminate trading risk.
Strategia

Low Volume Pullback Zones [AGPro Series]Low Volume Pullback Zones
🔷 Overview
Low Volume Pullback Zones is a trend-continuation overlay built for one very specific market behavior: a trend is already established, price retraces in a controlled way, volume dries up during that retracement, and the market later reclaims a continuation trigger.
The default profile is tuned for daily swing charts, where low-volume retracements usually form cleaner structural pockets and the chart has enough space for the boxes to read properly. A 4H Active preset is included for traders who want more frequent mapping, while Custom mode exposes the raw controls.
Many pullback tools focus only on price touching a moving average, a SuperTrend line, or a generic support/resistance area. This script is intentionally narrower. It looks for the quieter part of a trend: the moment where participation contracts during a retracement, the pullback stays shallow relative to the prior impulse, and a clean continuation pocket can be mapped with a visible invalidation boundary.
The goal is not to mark every trend candle. The goal is to isolate the cleaner pauses inside trend conditions where the pullback behaves like controlled absorption instead of aggressive reversal pressure.
🟩 What The Script Detects
The engine combines five layers:
1. Trend Side
The script first checks whether the market has a clean bullish or bearish trend profile using EMA alignment, EMA slope, DI direction, and ADX strength. If the trend is flat or mixed, the script avoids mapping low-quality pullbacks.
2. Low RVOL Retracement
During a pullback, the script measures relative volume against a rolling volume baseline. A stronger dry-up score means the retracement is happening with lighter participation, which often creates a cleaner continuation context than high-volume countertrend pressure.
3. Shallow Pullback Depth
The pullback is measured against the prior impulse reference range. Controlled retracements receive higher scores, while deep retracements move toward failure risk.
4. Continuation Trigger
The script waits for price to reclaim beyond the pullback pocket boundary with a small ATR buffer and relative-volume recovery. This prevents the chart from filling with premature pullback labels before the structure actually confirms.
5. Invalidation Boundary
Every active dry-up pocket has a structural boundary beyond the deepest pullback extreme. If price breaks that boundary, the pocket is treated as invalid rather than leaving an old setup on the chart.
🟦 Chart Visuals
The main visual layer is the Dry-Up Pullback Pocket.
When a valid pullback begins, the script draws a compact rectangular pocket around the retracement range. If the pocket confirms, the script projects a tighter functional retest/hold zone instead of extending the entire historical pullback range. This makes the zone easier to use: bullish zones focus on the reclaimed upper pocket area, bearish zones focus on the reclaimed lower pocket area, and the dotted invalidation boundary remains beyond the failed side of the structure.
Dry-Up Watch labels can appear before final confirmation when the pullback already has strong volume contraction and acceptable structure. Rejected context boxes are optional and disabled by default because they are diagnostic, not actionable hold zones. Trigger labels remain compact and controlled by cooldown logic. The default behavior keeps the chart active enough to be useful without making it feel crowded or noisy.
🟨 Info Panel
The panel summarizes the current state:
Trend Side - bullish trend, bearish trend, or no clean trend.
Dry-Up Score - how strongly volume contracted inside the active or most recent pocket.
Pullback Depth - retracement depth relative to the prior impulse.
Trigger State - mapping, triggered, expired, boundary lost, trend lost, or waiting.
Failure Risk - a compact risk read based on depth, volume behavior, and pullback duration.
The panel location, panel theme, panel font size, and label font size are configurable from settings. The first panel row follows the AGPro Series standard format with a single merged blue header row.
🟪 What Makes This Different
This script is not a generic trend meter.
It is not a SuperTrend reaction tool.
It is not a broad continuation score dashboard.
It is not a volume spike or climax detector.
Low Volume Pullback Zones is focused on the relationship between trend continuation and volume contraction during the retracement itself. That makes the script different from tools that only measure trend strength, moving-average reclaim, breakout quality, support/resistance reactions, or high-volume pressure events.
The core question is:
Did the pullback become quiet enough, shallow enough, and controlled enough to justify a mapped continuation pocket?
That narrow question is what gives the script its identity.
🧭 How To Read It
Bullish dry-up pocket:
The trend filter is bullish, price retraces into the EMA lane, average RVOL contracts, depth remains controlled, and price reclaims the upper pocket boundary.
Bearish dry-up pocket:
The trend filter is bearish, price retraces upward into the EMA lane, average RVOL contracts, depth remains controlled, and price reclaims the lower pocket boundary.
Failure risk:
Failure risk rises when the pullback becomes too deep, too long, or too active in volume terms. A higher failure risk means the retracement is no longer behaving like a quiet continuation pause.
Invalidation boundary:
The dotted boundary marks the structural area where the active pocket is no longer considered valid.
⚙ Key Settings
Engine Preset:
Daily Swing is the default and is designed for cleaner publication-grade structure. 4H Active keeps more frequent lower-timeframe pockets. Custom uses the direct input values.
Fast / Mid / Slow EMA Lengths:
Control the trend structure used by the pullback engine.
Minimum ADX and Minimum EMA Slope:
Help the script avoid mapping dry-up pockets in flat conditions.
Relative Volume Length:
Defines the baseline used to measure volume dry-up.
Preferred Pullback RVOL:
Controls how quiet the pullback should be to receive full dry-up credit.
Preferred Max Depth:
Defines the ideal shallow retracement threshold.
Trigger Buffer:
Adds a small ATR-based confirmation buffer beyond the pullback pocket.
Pocket Projection Bars:
Controls how far completed pockets extend to the right.
Functional Zone Width:
Controls how much of the original pullback range is projected after confirmation. Smaller values create a tighter retest/hold pocket; larger values keep more of the original pullback structure.
Label Cooldown and Max Structures:
Keep the overlay readable and publication-clean.
📌 Best Use
This indicator is best used on markets that already show directional structure. It is designed for traders who study trend continuation, relative volume behavior, pullback quality, and invalidation-based chart structure.
It can be used across crypto, forex, indices, equities, and commodities, but the most useful results generally appear when the market has enough trend strength for low-volume retracements to matter.
🟧 Design Philosophy
Low Volume Pullback Zones was built to keep the chart premium and readable:
Clean pocket boxes instead of noisy background clutter.
Restrained watch and trigger labels instead of constant marker spam.
Visible invalidation boundaries instead of ambiguous zones.
Professional RVOL and depth scoring instead of simple moving-average touches.
Configurable panel and label sizing for different chart layouts.
The script is intentionally selective. Its strongest value comes from filtering out ordinary pullbacks and highlighting the ones where trend, volume dry-up, shallow depth, and continuation confirmation align.
Indicatore

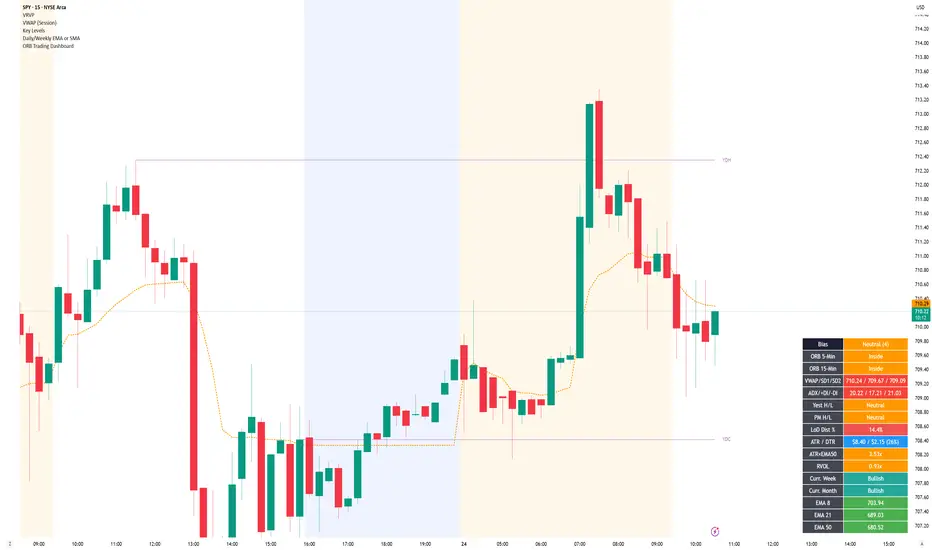
ORB Trading DashboardORB Trading Dashboard is a multi-factor intraday decision-support indicator built for fast market context.
It combines opening range behavior, trend structure, momentum, volume, and key levels into a single table with a weighted directional bias.
Features
Multi-timeframe ORB Status (5m / 15m / 30m)
Location-based ORB logic after each window completes
Bullish above ORB high
Bearish below ORB low
Inside = price within range
Time gates:
5m after 9:35 ET
15m after 9:45 ET
30m after 10:00 ET
Weighted Bias Model (max +/-21)
Converts multiple market factors into a single directional score
Bias states:
Strong Bull
Bullish
Lean Bull
Neutral
Lean Bear
Bearish
Strong Bear
EMA Trend Structure
Price vs Daily EMA 8 / 21 / 50 / 100 / 200
EMA stacking used to grade trend quality
VWAP Context with Volatility Bands
Session VWAP with SD1 / SD2 levels
Bias adjusts based on price relative to VWAP and SD1
Key Level Context
Yesterday high/low behavior
Premarket high/low behavior
Session position (top / mid / bottom of intraday range)
Higher Timeframe Directional Filter
Current week open status
Current month open status
Momentum & Participation
DMI / ADX direction and trend strength
Relative Volume (RVOL) confirmation or low-conviction penalty
Extension Awareness
ATR multiples from Daily EMA50 to identify trend health vs overextension
Practical Dashboard Metrics
LoD distance %
ATR / DTR %
RVOL
Weekly / monthly status
Optional EMA and key level plots
Settings
Display Options
Table position
Text size
Toggle rows:
ORB 5-Min
ORB 30-Min
Session High/Low
Toggle chart plots:
Daily EMA 8 / 21 / 50 / 100 / 200
Yesterday High/Low
Premarket High/Low
Alert Options
Enable 5-Min ORB alerts
Enable 15-Min ORB alerts
Enable 30-Min ORB alerts
Indicator Inputs
DMI/ADX length
ADX smoothing
How to Use
Use the bias score as a structured context layer, not as a standalone signal.
Combine it with your own entries, risk management, and session awareness.
Optional: How to Read the Table
Bias: composite directional score
ORB 5/15/30: opening range state (Bullish / Bearish / Inside)
VWAP / SD1 / SD2: mean and volatility context
ADX / DI: trend strength and direction
Key levels: yesterday, premarket, session positioning
Metrics: LoD %, ATR/DTR, ATR vs EMA50, RVOL
Disclaimer
This indicator is for educational and informational purposes only.
Always perform your own analysis and manage risk appropriately.
Indicatore
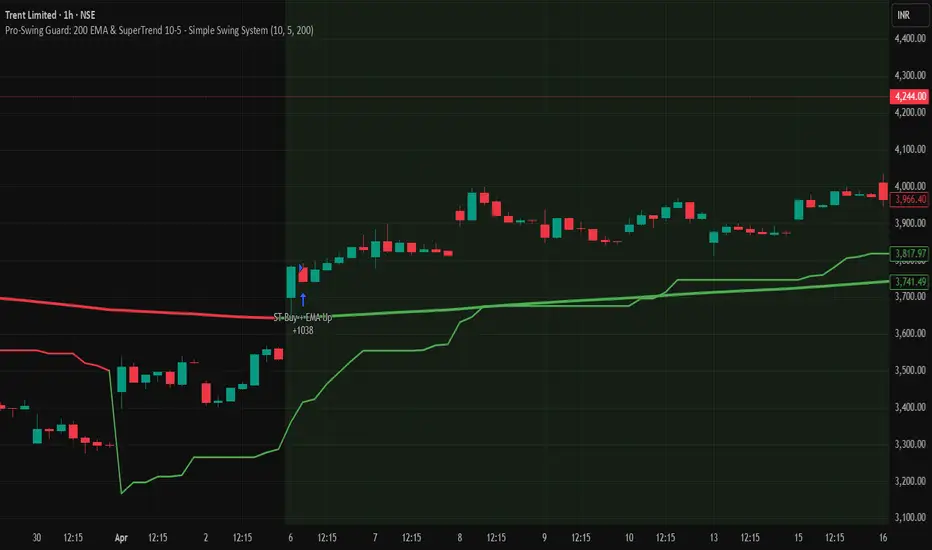
Pro-Swing Guard: 200 EMA & SuperTrend 10-5 - Simple Swing SystemThe Pro-Swing Guard is a disciplined, trend-following system designed to simplify high-probability trading for both stocks and indices. Built on the core principle of "Trading with the Tide," this strategy is the primary engine for The Stock Yogi's trading philosophy: eliminating market noise and avoiding the traps of sideways price action.
By combining the structural strength of the 200-period Exponential Moving Average (EMA) with a conservative, high-factor SuperTrend (10, 5), the Pro-Swing Guard ensures you only participate when the big money momentum and long-term structure are perfectly aligned.
The "3-Step Verification" Logic
This system follows a strict institutional-grade logic to confirm every entry:
The Structural Filter (200 EMA): We only look for Longs when the price is trading above the 200 EMA and Shorts when below. This ensures you are never standing in front of a high-speed train moving in the opposite direction.
The Slope Sentinel: The script automatically detects the angle of the 200 EMA. It only triggers signals when the EMA is actively sloping (Upward for Buy / Downward for Sell), effectively keeping you on the sidelines during "dead" or choppy markets.
The Volatility Buffer (The 10-5 Factor): While most retail traders use a standard 3.0 multiplier, we use a 5.0 Multiplier. This "Game Changer" adjustment creates a wider safety zone, allowing the stock to breathe and preventing you from being "shaken out" by minor intraday volatility.
Key Features & Toggles
Directional Control: Built-in toggles to enable/disable Long or Short trades based on your daily market bias or higher timeframe analysis.
Risk Management Toggle:
Trend Rider Mode (Default): Exit on a SuperTrend color flip to capture massive, multi-week swing moves.
Disciplined Target Mode: Switch on the Risk-to-Reward (RR) Toggle to set a fixed target based on the Entry Candle's high/low for consistent compounding.
Institutional Sizing: Defaulted to an initial capital of 50 Lacs with a 40% equity-per-trade allocation for realistic portfolio backtesting.
How to Trade with Pro-Swing Guard
Best Timeframes: Highly optimized for 15m/1h (Intraday Momentum) and Daily/4h (Swing Trading).
Confirmation: A valid signal is generated when the SuperTrend flips color ONLY IF the price is on the correct side of the 200 EMA and the EMA slope is confirmed.
Visual Cues: The chart background highlights valid entry zones (Green for Bullish / Red for Bearish) to keep your eyes focused.
Disclaimer & House Rules
This indicator is an educational tool designed by The Stock Yogi to assist in data-driven decision-making.
Trading involves significant financial risk. Past performance does not guarantee future results.
Always practice proper risk management and test on a demo account before live deployment.
Developed by The Stock Yogi
"In a world of noise, discipline is your only edge. Let this tool handle the trend, while you handle your mind."
Strategia
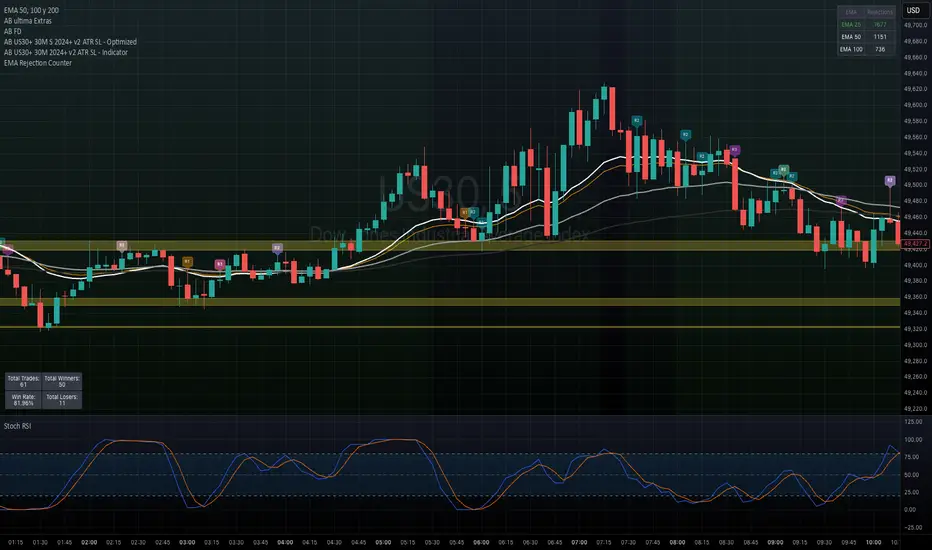
EMA Rejection CounterEMA Rejection Counter
EMA Rejection Counter is a simple yet powerful tool designed to measure how often price gets rejected from key exponential moving averages. Instead of guessing which EMA “respects price” the most, this indicator gives you actual data.
What It Does
This indicator tracks and counts rejection events on up to three customizable EMAs.
A rejection is defined as:
Price approaches the EMA
Touches the EMA during the candle
Then closes away from it
This helps identify which EMA is acting as the most reliable dynamic support/resistance.
Features
✅ Track 3 customizable EMAs (default: 25 / 50 / 100)
✅ Automatic detection of bullish & bearish rejections
✅ Live rejection counter for each EMA
✅ On-chart labels (R1, R2, R3) to visualize rejection points
✅ Clean table display showing total counts
✅ Highlights the most respected EMA in real-time
How to Use
Use this tool to identify which EMA price is reacting to most
Combine with your trend strategy (e.g., pullbacks, continuations)
The EMA with the highest rejection count often acts as the key level
Example Use Cases
Finding the best EMA for your strategy
Confirming dynamic support/resistance
Filtering entries based on EMA reactions
Enhancing trend-following systems
Notes
This is a statistical tool, not a standalone trading signal
Works best when combined with price action and market structure
Results may vary across timeframes and assets
Indicatore
2min 13-48-200 EMA + LevelsFeatures:
- 13 + 48 + 200 ema lines, calculated from a specified time frame (2min as default) that doesn't change with timeframe (useful if you want to see 2min ema lines in a 5min time frame
- Colored zones to indicate relationship between ema's:
> Light Green + Dark Green = 13 ema above 48 ema above 200 ema = bullish
> Light Red + Dark Red = 200 ema above 48 ema above 13 ema = bearish
> Combination of red and green = possible reversal
- Level lines calculated from previous day + pre market highs and lows
Customizable settings:
- EMA lines colors and thickness
- EMA zone colors
- Level line color and thickness
- Ema label text and background colors
Indicatore

EMA CloudEMA Cloud — Dynamic Trend Visualization
This indicator plots a color-coded cloud between two EMAs to give you an instant read on trend direction and momentum.
How it works:
The cloud fills green when the fast EMA is above the slow EMA (bullish bias)
The cloud fills red when the slow EMA crosses above (bearish bias)
The crossover itself signals a potential trend shift
Fully customizable:
Fast and slow EMA periods (default: 9 / 21)
Individual colors for each EMA line
Bull and bear cloud colors
Best used as a trend filter — combine it with a momentum indicator or volume to confirm entries. Works on any timeframe and asset class.
Indicatore

Indicatore
KARTHIK TENKASI EMA9 + RSI50 First Break Strategy (Long Only)9 EMA + 50 RSI LONG ONLY STRATEGY
this is a long only strategy that will help in detecting long trades without noise
Strategia

Stockbee + EMA ScannerThis scanner gives setups — not trades
Step 1
Run TradingView screener → shortlist stocks
Step 2
Open charts with script applied
Step 3
Only take trades when:
👉 EMA alignment holds
👉 Signal appears (triangle)
👉 Entry = breakout or pullback
Indicatore

Smart Flag Clean 5/12 EMA + Chop FilterThis is an updated version to my previous 5/12 EMA crossover with buy/sell flags. In this version I've attempted to have the flags labeled based on setup. Still a work in progress but basically I've found that if the SMA 20 is moving through the candles instead of having some separation that the crossovers don't work as well. So, I'm still trying to perfect this script to eliminate flags in choppy situations. Feel free to take it and modify it anyway you want. I'm publishing it so that maybe someone out there can take this concept and improve upon it.
thanks,
Ajroland
Indicatore

EMA/MA[jackieeee]Description
This indicator combines multiple EMAs and SMAs in one overlay, allowing traders to track short-, medium-, and long-term trend structure on a single chart. It includes six EMAs and five simple moving averages, each with customizable lengths and sources, making it useful for trend confirmation, dynamic support and resistance, and overall market structure analysis.
Indicatore

CREA Composite MA v3Here's a clean description you can use as the indicator's published description on TradingView:
CREA Composite MA v3 — Multi-Layer Confluence Indicator
CREA Composite MA is a momentum and trend confluence engine disguised as a moving average. Rather than plotting a single indicator, it combines seven sub-indicators into one normalised 0–100 composite score, then runs that score through three layers of confirmation before generating a signal.
The seven components:
EMA Bias (EMA10/20 stack and price position)
MFI (Money Flow Index)
ADX with +DI/−DI directional spread
Volatility (inverse ATR%, environment-adjusted)
Delta (candle body direction and size)
Volume (Z-score, directionally weighted)
Momentum (Rate of Change, normalised)
Each component is independently normalised to 0–100. Scores above 50 are bullish, below 50 are bearish. All weights are fully adjustable.
Three confirmation layers:
Layer 1 — Component agreement: counts how many of the 7 sub-indicators individually agree with the direction. A composite score of 65 built on 6/7 components is treated differently from one built on 2 components spiking hard.
Layer 2 — HTF filter: rebuilds the full composite on a user-selected higher timeframe (default 15m) and gates signals accordingly. Bull signals are suppressed when the HTF composite is bearish, and vice versa. The HTF line is plotted directly on the pane so both timeframes are visible simultaneously.
Layer 3 — Score velocity: measures the 3-bar rate of change of the composite itself. A rising score carries more weight than a flat one at the same level.
Two-tier signal system:
EARLY (yellow) — fires on signal line crossover when ≥4/7 components agree and HTF is aligned. Appears before the threshold is reached, giving advance warning of a potential confirmed signal.
CONFIRMED (green/red) — fires on threshold cross when ≥5/7 components agree and HTF is aligned. Labelled with confidence tier (HIGH / MED / LOW) and agreement count (e.g. BULL HIGH 6/7).
BLOCKED (gray) — threshold was crossed but confirmation gates rejected it. Useful for auditing filter performance.
Confidence tiers:
HIGH — 6–7 components agree + velocity moving in signal direction
MED — 5+ components agree
LOW — 4+ components agree
HUD table (bottom-right) shows all seven component scores in real time, color-coded by strength, alongside the composite score, HTF score and bias, confidence tier, and velocity direction.
7 alert conditions included: Early Bull/Bear, Confirmed Bull/Bear, Blocked Bull/Bear, and HIGH Confidence.
All lengths, weights, thresholds, and filter settings are fully configurable via the settings panel.
Indicatore

SMA & EMA [FIBO]This indicator provides a comprehensive suite of Simple Moving Averages (SMA) and Exponential Moving Averages (EMA) in a single script, designed for both short-term momentum and long-term trend analysis.
The periods are heavily based on the Fibonacci sequence, along with standard psychological levels (100 and 200), giving you a complete map of dynamic support and resistance zones.
Key Features:
Short-Term SMAs: 5, 8, 13
Medium & Long-Term EMAs: 21, 34, 55, 89, 100, 144, 200, 233, 377
Zero Interface Clutter: The "Inputs" tab is kept completely empty for a distraction-free experience. You can toggle the visibility of each moving average, change colors, and adjust line thickness directly from TradingView's native "Style" tab.
Dark Mode Ready: Default colors are specifically chosen to be vibrant and distinct on dark-themed charts.
How to Use:
Track the short-term SMAs (5, 8, 13) to spot immediate momentum shifts and fast crossovers.
Use the mid-to-long-term EMAs (like 55, 100, 200) as dynamic support and resistance levels or to determine the macro trend direction.
Since all averages are bundled in one script, you save indicator slots. Simply hide the ones you don't need via the Style tab to keep your chart clean.
Indicatore

EMA + MACD + RSI Confluence SignalDescription:
This indicator identifies high-probability trend reversal and continuation points by requiring three independent momentum conditions to align simultaneously before printing a signal. Once a signal is printed, no duplicate is shown until the opposite side triggers — keeping your chart clean and unambiguous.
Signal Logic
A BUY label appears when the last of the following three conditions falls into place while the other two are already active:
9 EMA crosses above 20 EMA (bullish alignment)
MACD line crosses above Signal line (golden cross)
RSI crosses above its own 14-period EMA (momentum shift)
A SELL label appears on the mirror-image bearish confluence.
Signals alternate strictly: after a BUY, no further BUY labels appear until a SELL is confirmed, and vice versa.
Confluence Ribbon
The ribbon filled between the 9 EMA and 20 EMA reflects real-time signal strength across 6 conditions:
# / Condition / Bull / Bear
1 / EMA alignment / Fast > Slow / Fast < Slow
2 / MACD cross / MACD > Signal / MACD < Signal
3 / RSI cross / RSI > RSI EMA / RSI < RSI EMA
4 / RSI level / RSI > 50 / RSI < 50
5 / RSI EMA level / RSI EMA > 50 / RSI EMA < 50
6 / MACD histogram / Histogram > 0 / Histogram < 0
The ribbon fades from nearly transparent (1 condition) to solid color (all 6), giving you an at-a-glance read of how strong the current trend environment is — even between signals.
Settings
Parameter / Default / Description
Fast EMA / 9 / Fast EMA period
Slow EMA / 20 / Slow EMA period
MACD Fast / 12 / MACD fast length
MACD Slow / 26 / MACD slow length
MACD Signal / 9 / MACD signal smoothing
RSI Length / 14 / RSI period
RSI EMA Length / 14 / EMA applied to RSI
RSI Level / 50 / Midline for conditions 4 & 5
How to Use
Add the indicator to any chart and timeframe. Works on all assets.
Watch the ribbon color: green = bullish pressure building, red = bearish. The more opaque, the more conditions are aligned.
Wait for a BUY or SELL label — this is your signal entry bar.
Use the ribbon between signals to gauge whether the trend is holding or weakening.
Set an alert via right-click → Add Alert on the indicator for hands-free notification.
Tips
Higher timeframes (15m, 1H) produce fewer but higher-quality signals.
A strong ribbon (5–6 conditions) that precedes a label increases conviction.
Combine with support/resistance or session levels for best results.
Indicatore

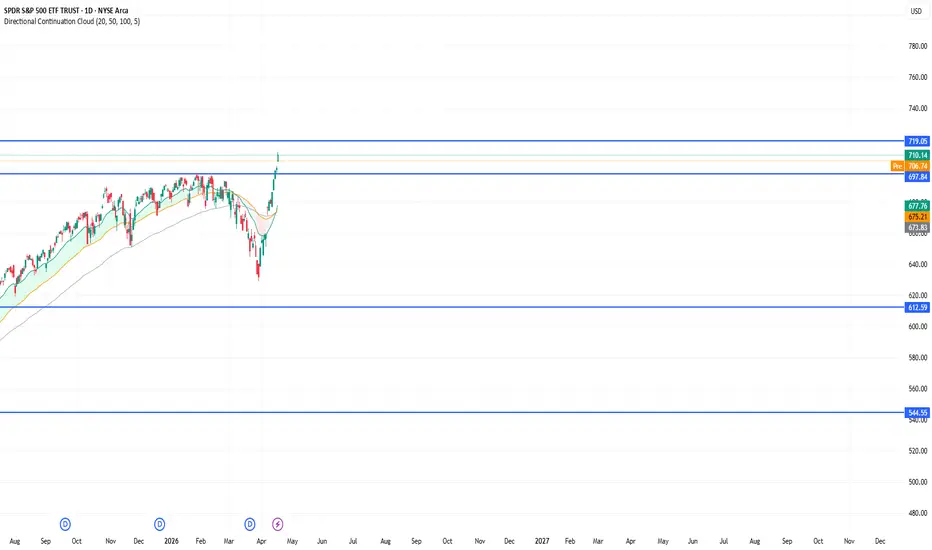
Directional Continuation Cloud
Directional Continuation Engine v1 is a trend-following pullback script designed to identify continuation entries after controlled retracements. It combines trend structure, trend quality, pullback health, and momentum triggers to help avoid chasing extended moves or trading low-quality chop. It is built for continuation setups, not top or bottom picking.
Indicatore
MTF Trend Agreement Map [AGPro Series]MTF Trend Agreement Map
🔹 **Overview**
MTF Trend Agreement Map is a multi-timeframe alignment engine that reads the trend across five timeframes at once and distills the result into a single transparent agreement score. Instead of forcing you to flip between charts, the map tells you, on every bar, how many timeframes agree, which side wins, and whether the market is in a locked regime, a forming trend, or a conflict phase. It is built for swing traders, HTF-bias scalpers, position traders, and anyone who uses top-down analysis as part of their process.
🔸 **What Makes It Different**
Most MTF indicators show a single method (usually a moving-average cross) repeated across timeframes, which means five rows that all agree with each other by construction. This map does something different: for each timeframe it runs three independent methods — an EMA regime filter, a pivot-based market-structure read (HH/HL vs LH/LL), and a normalized momentum slope — and blends their individual votes into the final score. You see not only the agreement across timeframes but also the agreement across methods, which exposes weak or borderline regimes that a single-method tool would quietly hide.
🔺 **Methodology**
• EMA Trend: a timeframe is bullish when EMA50 is above EMA200 and price is above EMA50; bearish on the mirror condition; neutral otherwise.
• Market Structure: confirmed pivots are tracked in real time. A timeframe is bullish while the last two confirmed swings form higher highs and higher lows, bearish on lower highs and lower lows.
• Momentum Slope: the change in linear regression across a configurable lookback, normalized by ATR so that fast and slow assets are comparable.
• Consensus per timeframe: each active method casts a vote; bulls minus bears determines the row's net direction and strength.
• Overall alignment: bull and bear votes are summed across all active timeframes; the dominant side's share defines the agreement percentage.
◆ **Three-State Regime Engine**
• **LOCKED** — agreement above the strong threshold (default 80%). High-conviction regime, continuation-friendly, background tint activates.
• **TRENDING** — agreement between 50% and the strong threshold. Directional bias forming but not yet fully aligned. Trade with reduced size or wait for confirmation.
• **SPLIT** — agreement below 50%. Timeframes are in conflict, no majority side. Classic chop phase, favors mean-reversion strategies or standing aside.
🔔 **Signals & Alerts**
• Regime Lock (Bull or Bear): fires the first bar agreement crosses above the strong threshold while one side dominates. Designed as a continuation trigger, not a reversal signal.
• Chop / Conflict: fires when no side holds the majority, a classic filter for mean-reversion systems or a stand-aside cue for trend traders.
• Both generic and directional alertcondition() hooks are exposed so you can wire the map into automations.
⚙️ **Key Inputs**
• Core Engine: toggle any of the three methods on or off, and tune the pivot length and momentum lookback independently.
• Timeframes: four user-selected timeframes plus an optional Current row that auto-adapts to the chart TF. If the chart TF matches any selected TF, the Current row is hidden automatically to avoid double-counting.
• Panel: six location presets, four text sizes (default Normal), dark or light theme, optional per-method breakdown row.
• Background Tint: enable or disable, set the strong-alignment threshold (50–95%) and control transparency (70–99) to keep the chart premium.
📖 **How to Use**
• Top-down confirmation: take trades on your execution timeframe only when the higher rows in the map agree with your thesis.
• Regime filter: enable Regime Lock alerts to catch moments when the full map snaps into alignment — these are typical continuation windows.
• Conflict filter: when the map prints SPLIT, widen stops, reduce size, or step aside; trend strategies historically underperform during these phases.
• Method debugging: turn on the per-method breakdown to see which methods are driving the score and which are fighting it.
⚠️ **Limitations & Transparency**
• All timeframe values are non-repainting at bar close (lookahead is disabled), but intrabar values can update until the parent bar closes — this is expected MTF behavior.
• Market Structure requires enough history on each timeframe to confirm two swings; on very young assets or short charts the structure vote may be neutral until pivots print.
• The map is a context tool, not a standalone entry system — combine it with your own execution logic, risk management, and bias.
📌 **Risk Disclosure**
This script is provided for educational and analytical purposes only. It does not constitute financial advice, a recommendation, or a solicitation to trade any instrument. Markets involve substantial risk and past behavior does not guarantee future results. Always do your own research and manage risk responsibly.
Indicatore

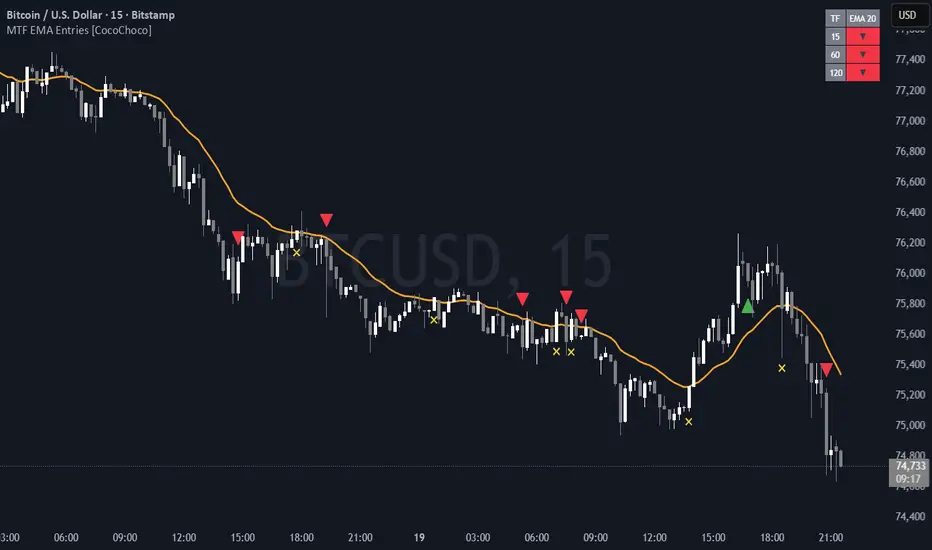
Trend-following MTF EMA Entries [CocoChoco]**MTF EMA Entries ** is a multi-timeframe trend-following indicator designed to identify high-probability entry points using EMA alignment and trend strength confirmation.
The script evaluates price relative to a configurable EMA (default 20) across three timeframes: a lower “execution” TF and two higher TFs.
A directional bias is established when price is above/below the EMA *and* the EMA slope confirms momentum (rising for longs, falling for shorts).
Trade signals are generated only when all three timeframes are fully aligned in the same direction.
To filter out weak or ranging conditions, an ADX-based strength filter (default threshold: 18) is applied on the execution timeframe, requiring increasing trend strength before allowing entries.
**Entries**
* Long: All timeframes bullish (price > EMA + rising EMA) + ADX confirmation
* Short: All timeframes bearish (price < EMA + falling EMA) + ADX confirmation
* Signals trigger once per move (no repeated entries)
**Exits**
* Triggered on price crossing back through the EMA on the execution timeframe
**Features**
* Optional EMA overlay
* Clean entry/exit markers
* Real-time dashboard showing trend alignment across timeframes
* Alert conditions for bullish and bearish entries
Best suited for traders seeking structured, trend-aligned entries with built-in momentum confirmation.
Indicatore
AOC Market Regime ClassifierHow it works
The indicator combines three core components:
EMA Structure (21 / 55) → measures directional bias
ATR (volatility normalization) → evaluates movement relative to market activity
Range Analysis (highest/lowest window) → detects compression and breakout conditions
Using these inputs, the script calculates:
Trend strength → distance between EMAs normalized by ATR
Range tightness → price compression relative to volatility
Breakout conditions → price escaping recent highs/lows
Regime Classification
The market is dynamically classified into four states:
TREND → Strong directional movement with sustained structure
RANGE → Low volatility, compressed price action
BREAKOUT → Price expansion beyond recent range
TRANSITION → Mixed or unclear conditions between regimes
Each regime is color-coded directly on the chart for quick visual interpretation.
What makes it useful
Helps filter trades based on market context
Prevents using the wrong strategy in the wrong environment
Highlights compression → expansion cycles
Keeps analysis simple and adaptive
How to use
Focus on trend-following strategies during TREND phases
Use mean-reversion approaches in RANGE conditions
Watch BREAKOUT for potential expansion opportunities
Be cautious during TRANSITION phases (lower conviction environment)
Key idea
Markets change behavior your strategy should too.
This tool helps you stay aligned with current conditions instead of applying a one-size-fits-all approach.
Indicatore

NIL - Dynamic Timeframe EMANIL - Dynamic Timeframe EMA (Limited)
This indicator automatically plots higher-timeframe EMAs (1H, 1D, 1W, 1M) on any chart timeframe while keeping your chart clean and professional.
It intelligently calculates the correct EMA length based on the current bar duration and automatically hides any EMA that matches or is lower than the chart's timeframe (no more redundant or flat lines).
Perfect for intraday traders who want to see daily, weekly, and monthly EMA context without manual adjustments.
═
█ OVERVIEW
The script converts standard time-based EMAs into dynamic periods:
• 1-hour EMA
• 1-day EMA
• 1-week EMA
• 1-month EMA
It uses approximate trading minutes (390 min per day, 21 trading days per month) for accurate calculations across all timeframes — from seconds to monthly charts.
Key Smart Feature:
The indicator automatically hides EMAs that are no longer meaningful:
• On 1H or higher → 1H EMA is hidden
• On Daily or higher → 1H + 1D EMAs are hidden
• On Weekly or higher → 1H + 1D + 1W EMAs are hidden
• On Monthly → only 1M EMA remains (if enabled)
This prevents visual clutter and keeps the chart focused.
═
█ FEATURES
Fully automatic period calculation based on current timeframe
Smart show/hide logic — no redundant lines
Dynamic info table showing actual periods used
Capping system to respect Pine Script's 5000-bar limit (configurable)
Clean, customizable colors and display options
Works on all timeframes (seconds, minutes, daily, weekly, monthly)
═
█ HOW TO USE
1. Add the indicator to any chart
2. Enable/disable each EMA via the inputs
3. Adjust colors as desired
4. (Optional) Increase "Max EMA Lookback" if working on very low timeframes
The top-right table will always show you:
• Which EMAs are active
• The exact period used for each
• Whether the period was capped
Best Use Cases:
• Intraday trading with higher-timeframe context
• Swing trading on lower timeframes
• Quickly assessing trend alignment across multiple time horizons
═
█ INPUTS
Display
• Show 1H EMA, Show 1D EMA, Show 1W EMA, Show 1M EMA
Colors
• Individual color selection for each EMA line
Limits
• Max EMA Lookback — protects against Pine Script calculation limits (default 5000)
═
█ NOTES & LIMITATIONS
• Calculations are performed on the chart's native data (not using request.security() — faster, no repainting).
• Uses standard trading session approximations (390 minutes/day).
• Very high periods on extremely low timeframes (e.g. 1-second) are automatically capped.
Enjoy cleaner charts with meaningful higher-timeframe EMAs!
Feel free to leave feedback or suggestions for future improvements.
Indicatore

SUPER DASHBOARD + SMA200 + SMART MONEY🚀 **SUPER DASHBOARD + SMART MONEY**
📊 A powerful all-in-one trading indicator that combines **trend, volume, momentum, liquidity, and Smart Money analysis** into a single, easy-to-read dashboard.
---
### 🔥 Key Features
🔹 **Trend Engine**
Uses EMA 20 / 50 and **SMA 200** to define the market direction
→ Clearly identifies bullish or bearish trends
🔹 **HTF Confirmation**
Higher Timeframe (Daily) trend validation
→ Adds confidence through multi-timeframe alignment
🔹 **Volume & Market Control**
Analyzes Buyer vs Seller dominance
→ Helps you understand who is driving the market
🔹 **Momentum (RVOL)**
Measures strength of price moves using relative volume
→ Filters out weak or fake moves
🔹 **Liquidity Filter**
Identifies high vs low liquidity stocks
→ Avoid illiquid and risky setups
🔹 **Smart Money Detector 🧠**
* 🟢 Accumulation → Institutional buying
* 🔴 Distribution → Institutional selling
* 💣 Capitulation → Potential bottom
🔹 **Alpha Score 👑**
Ranks stocks by strength (Leader / Weak)
→ Focus on high-quality opportunities
🔹 **Signal Engine 🎯**
* 🚀 BUY → Strong bullish setup
* 💥 SELL → Bearish signal
* ⚖️ WAIT → No clear edge
---
### 🧠 Why This Indicator?
Instead of relying on a single signal, it combines:
✔ Trend
✔ Volume
✔ Momentum
✔ Smart Money behavior
👉 Delivering a **complete market view in seconds**
---
### ⚠️ Best Practice
For optimal performance, combine it with:
📍 Support & Resistance levels
📍 Overall market context
---
💡 **Conclusion:**
This is not just an indicator — it’s a **complete trading system** designed for traders who want **clarity, precision, and professional-level decision-making**.
Indicatore
