Indicatore
Media mobile esponenziale (EMA)

MA / EMA 10/20/58/100/250
此腳本主要為 Day Trading 短線交易而設計,核心以 EMA(Exponential Moving Average,指數移動平均線)作為趨勢判斷工具。
透過不同週期的 EMA 配合價格走勢,幫助交易者更快判斷市場短線方向、趨勢強弱,以及潛在入場或離場位置。適合用於即市交易、短線追蹤趨勢、觀察支撐阻力及判斷回調後的續航機會。
此工具並非單純追買追賣,而是協助交易者更有系統地觀察市場節奏,減少情緒化交易,提高交易決策效率。
適合用於股票、指數、期貨、外匯及加密貨幣等不同市場。
⚠️ 注意:本腳本只作技術分析及交易輔助用途,並不構成任何投資建議。交易前請配合自身風險管理及交易策略使用。
Indicatore

EMA/SMA + Fixed Marker PivotsTrend Table — EMA/SMA + Fixed Marker Pivots
Multi-Timeframe Trend-Übersicht für saubere Top-Down-Analyse. Zeigt auf einen Blick, in welchem Trendzustand sich ein Asset auf 15m, 1H, 4H, 1D und 1W befindet — direkt am Chart, ohne Timeframe-Wechsel.
Was er macht
Der Indikator kombiniert zwei visuelle Elemente:
1. Trend-Tabelle (rechts oben)
Bewertet jeden Timeframe als UPTREND, DOWNTREND oder SIDEWAYS anhand der Position des Preises zu EMA20 und SMA50.
2. Fixed Trend Marker (Pivots am Chart)
Markie
Indicatore

EMA CrossXEMA CrossX is a buy-only trend-following strategy built around a simple but effective dual EMA crossover system. It is designed to catch bullish momentum shifts by entering long positions when the fast EMA crosses above the slow EMA, with optional delayed entries to help filter noise and reduce early false signals.
The strategy includes strict built-in risk controls using fixed stop loss and take profit levels, along with an optional trailing stop mode for traders who prefer to let winners run.
Strategia

ADX Flaeche (TIG)Here is a professional and concise description for your TradingView script, written in English.
ADX Area (SMA) with Price Scale
This indicator provides a clean, visual representation of trend strength using the Average Directional Index (ADX). Unlike the standard Wilder’s smoothing, this version utilizes a Simple Moving Average (SMA) for the final ADX calculation, making it slightly more responsive to recent price changes while maintaining clarity.
How it works:
Trend Strength Visualization: T
Indicatore

EMA Cross by MKEMA Crossover by Manojkumar tamil indicator with symbol
Buy/Sell signals on crossover
Visual markers (crosses)
Colored lines (green + yellow)
Indicatore

Indicatore
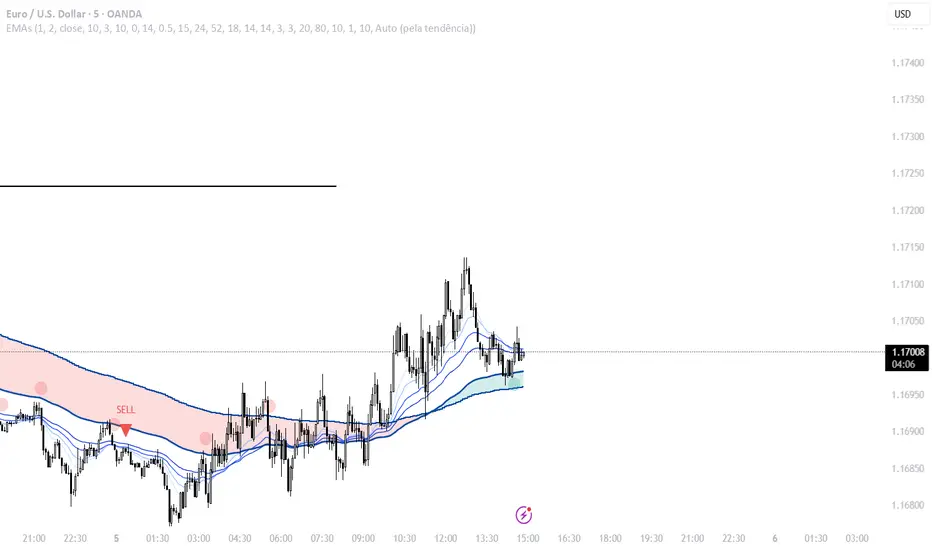
Degain Mid Points + EMA Dashboard This indicator provides a multi-timeframe market structure view by combining key midpoints and exponential moving averages (EMAs) into a single dashboard.
It calculates important high–low midpoints across multiple periods (1D, 3D, 7D, 20D, 50D, 100D, and 200D) and aligns them with corresponding EMA levels. This helps traders quickly identify trend direction, dynamic support/resistance, and price positioning.
Watch for:
EMA 20 + 50 crossover near midpoint → strong trend continuation
Price reje
Indicatore

Glowing Moving Average Ribbon [icreature]Hi all,
This version simply adds a glow effect to the MA ribbons for dark mode users. Enjoy!
Indicatore
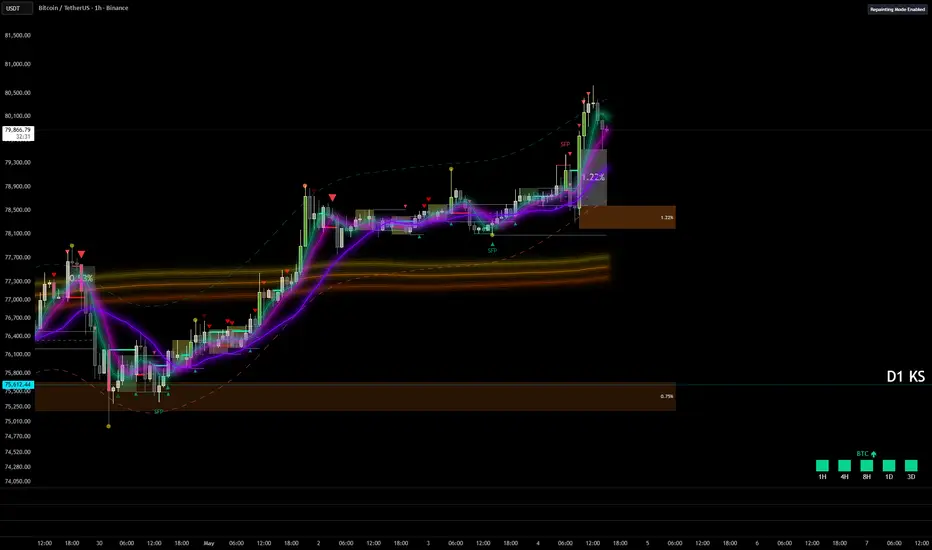
Z-Score Mean Reversion ProZ-Score Mean Reversion Pro is a Strategy designed to identify high-probability mean reversion setups by combining statistical Z-Score extremes with RSI momentum confirmation, Bollinger Band volatility filtering, and EMA trend alignment. It provides clean buy/sell signals, visual trade zones, dashboard data, and alert outputs to assist in short-term reversal trading, intraday setups, and swing mean reversion trades.
🔑 FEATURES
Z-Score Mean Reversion Engine: Detects statistically stretched pri
Strategia
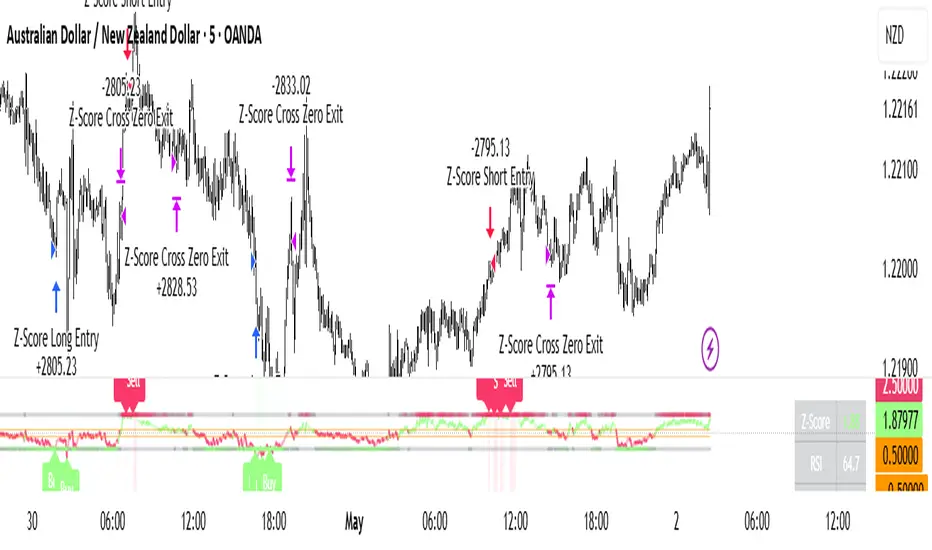
NORN WEAVE | URUZ Overview
NORN WEAVE ᚢ URUZ is the second version of NORN WEAVE ᚠ FEHU. The core logic — EMA slope, Dow Theory swing structure, ADX trend confirmation — is unchanged. What changed is the settings.
FEHU had too many parameters to configure manually. URUZ reduces that friction in three ways.
Focus Level replaces the raw EMA period with a single knob. Set the swing detection period, and the EMA scales automatically. One number instead of two.
Auto Calibration computes the ADX threshold, ATR
Strategia

Indicatore

13 EMA Cross + RSI 50 = Buy / Sell
13 EMA Cross + RSI 50 Description:
A simple yet effective signal indicator combining price action, a dynamic EMA level, and RSI momentum confirmation.
How it works:
🟢 Buy Signal = A bullish candle opens below the 13 EMA and closes above it, confirming a momentum shift to the upside. The signal is only valid when RSI has crossed above the 50 level within the last 1–2 candles, confirming that momentum is turning bullish.
🔴 Sell Signal = A bearish candle opens above the 13 EMA and closes below
Indicatore

Order Block Zone Study + ConfirmationOrder Block Zone Study + Confirmation marks support and resistance order-block zones, then helps users judge whether price is only reaching a zone or reacting with confirmation.
It is designed to answer three simple questions:
Where is the order-block zone?
How strong is the zone based on the model?
Is price only touching it, or is confirmation also active?
The goal is not to give automatic trade calls. The goal is to make order-block zones easier to read, compare, and monitor.
==
Indicatore

HTF/LTF Alignment ("Trend Is your Friend, Until the end!")HTF/LTF Alignment Dashboard
A clean multi-timeframe bias dashboard built around the 9 and 13 EMA. Tracks 9/13 EMA direction across three user-defined timeframes simultaneously and shows whether they're aligned at a glance — without making you flip charts.
What it does
Reads the 9 EMA (blue) and 13 EMA (grey) on three independently selectable timeframes (defaults: 1H / 15m / 5m) and prints the result as a compact dashboard on your chart. Each timeframe is color-coded — green when 9 EMA is above 1
Indicatore

Lucky13ema🚀 Lucky13ema - 1-Min Momentum Scalper
What it is
A filtered momentum strategy built around the 13 EMA crossover on 1-minute charts. Catches clean price breaks above/below the 13 EMA with 3 quality filters to reduce noise and improve win rate.
Core Logic
BUY: First green candle closing above 13 EMA (after being below)
SELL: First red candle closing below 13 EMA (after being above)
Triple Filter System:
Volume > 20-period SMA × 1.2x (confirms conviction)
VWAP alignment (longs above VWAP, shorts
Strategia

ADX/ MACD/ 200 EMA Strawberry Signals 🍓 Strawberry Signals 🍓
The Strawberry Signals indicator is a trend-following trading tool designed to help traders identify high-probability market entries by combining three core components:
trend direction (EMA 200), momentum (MACD), and trend strength (ADX) .
Signals are only displayed on confirmed candles to ensure stability and avoid repainting behavior.
📌 Indicator Concept
This indicator focuses on trading in the direction of the dominant trend. Instead of generating frequent sig
Indicatore

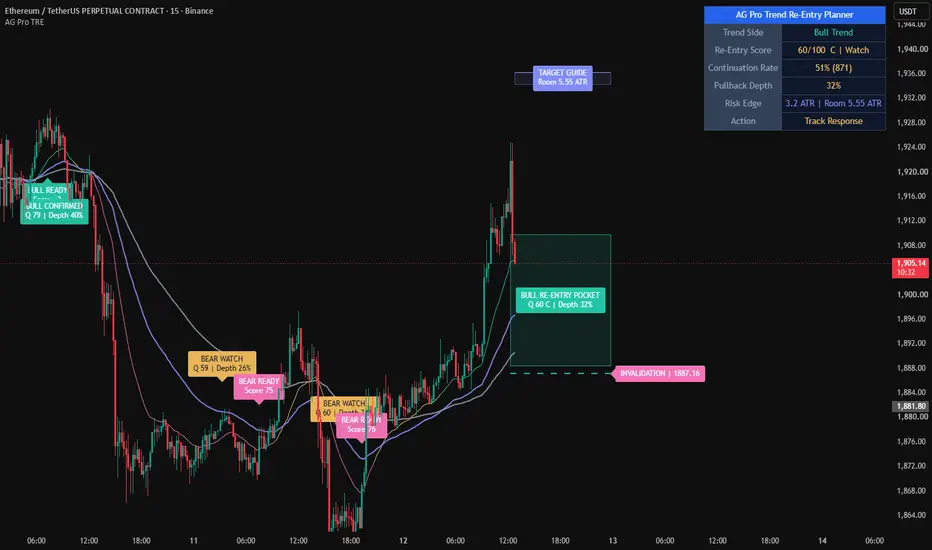
Trend Re-Entry Planner [AGPro Series]Trend Re-Entry Planner
🧠 Core Idea
Is an active trend pullback creating a clean re-entry planning context, or is the reset becoming too risky?
📌 Overview / What it does
Trend Re-Entry Planner is a chart-first trend continuation planning tool designed to evaluate pullbacks inside an active trend structure. The default profile is tuned for 1H charts, where re-entry pockets, trigger candles, invalidation edges, and target-room context usually remain more readable.
The script builds a re-e
Indicatore
Trend Pullback Risk Planner [AGPro Series]Trend Pullback Risk Planner
🧠 Core Idea
Is the current pullback normal trend digestion, or is it becoming a risk shift that deserves review?
📌 Overview / What it does
Trend Pullback Risk Planner is a chart-first trend risk planner built to evaluate active pullbacks inside an established trend.
The script maps a Pullback Risk Pocket, trend defense line, invalidation reference, target-room guide, compact state labels, alert conditions, and a clean AGPro panel. It converts trend slope, pu
Indicatore

7 Multi-Timeframe EMA Clouds-----------------------
done with luxalgo quant
---------------------------
7 ema cloud on other TF
-------------------
Indicatore

NEIL'S Dual MACD (5min & 15min)⏱️ Multi-Timeframe MACD — Smarter, Faster Analysis
This indicator is built to simplify one of the most common challenges traders face: constantly switching between timeframes to confirm MACD signals.
Instead of flipping between the 5-minute and 15-minute charts, this tool brings both together into a single view—allowing you to analyze momentum, trend direction, and signal alignment without interrupting your workflow.
🚀 Why This Indicator?
Many traders rely on multi-timeframe confirmation to
Indicatore

NEIL'S FX Sessions + EMA + Prev Day HLThis indicator is designed to provide a complete market overview by combining session tracking, dynamic trend analysis, and key price levels into a single, clean framework.
It highlights the major trading sessions—Sydney, Tokyo, London, and New York—allowing traders to understand when volatility and liquidity are most active. This helps in aligning trades with the most relevant market hours.
The indicator also includes six customizable EMA slots, enabling users to analyze short-term and long-t
Indicatore

Alpha Forge Accumulation LiteAlpha Forge Accumulation Lite is an open-source overlay designed to visualize possible long-term accumulation conditions on higher-timeframe charts.
The script is not built for intraday trading, exact bottom detection, or short-term entries. Instead, it provides a visual framework for studying when an asset is trading below its longer-term trend context while additional correction and stabilization conditions are present.
Core Idea
The script asks a simple chart-analysis question:
Is this as
Indicatore

Indicatore