Indicatore
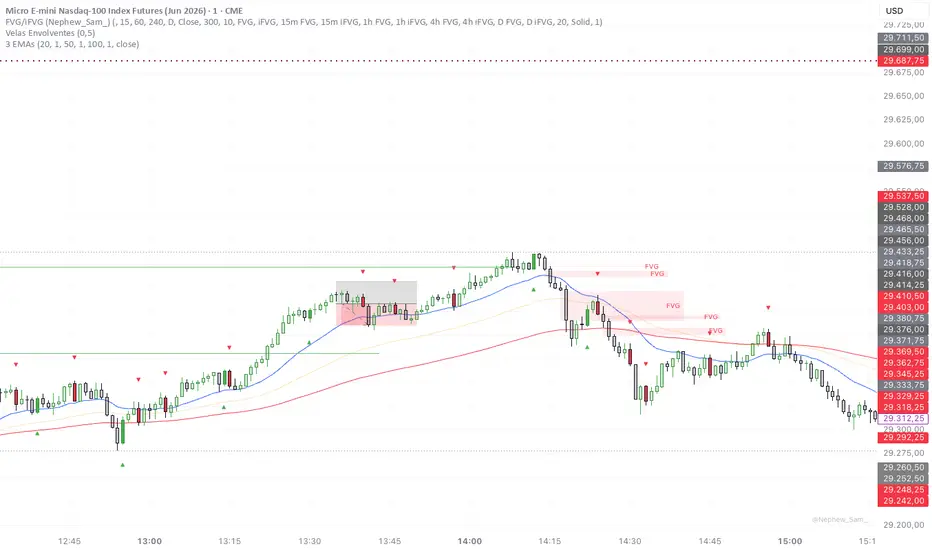
EMA's [Ordinary Trader]EMAs by Plots two parallel stacks of three EMAs — one anchored to a Higher Timeframe of your choice, one following the chart's current timeframe. Built around the Ordinary Trader methodology, where the 15-minute 50 / 100 / 300 EMA stack acts as a higher-timeframe directional filter while trading on lower timeframes.
**WHAT YOU SEE ON THE CHART**
Six EMAs total, split into two groups:
- **HTF EMAs** — three EMAs locked to a higher timeframe of your choice (default 15-minute). They stay anchored to 15-minute data even when you drop the chart to 1m, 3m, or 5m. Drawn as **thick** lines.
- **LTF EMAs** — three EMAs that follow the chart's current timeframe (or any specific lower timeframe you pin them to). Drawn as **thin** lines.
Same colour for the same EMA length across both groups: 50 = sage green, 100 = terracotta orange, 300 = purple-grey. Thickness tells you which timeframe you're looking at; colour tells you which EMA length.
**HOW TO USE IT**
The default setup is the Ordinary Trader 15-minute filter: HTF set to 15-minute, LTF following the chart. Pull up a 1m, 3m, or 5m chart and you'll see both groups at once — the thick lines are your 15-minute anchor, the thin lines are your chart-timeframe stack for entries.
By default the 50 and 100 EMAs are on in both groups; the 300 EMA is off but available. Flip it on in the Settings panel if you want the full stack.
**AUTO-HIDE FOR THE LTF GROUP**
When your chart timeframe is equal to or higher than the HTF timeframe, the LTF group hides automatically. So on a 15-minute chart (with HTF still at 15-minute) only the HTF group shows — no point drawing the LTF stack on top of an identical HTF stack. Same on the 1-hour, daily, or higher.
**VISUAL SMOOTHING**
When a higher-timeframe EMA is plotted on a lower-timeframe chart, it naturally looks stepped — each new HTF bar updates the EMA in one chunk, so the line moves in jumps rather than smoothly. The Visual Smoothing option (on by default) applies a light smoothing pass so the line reads cleanly on lower-timeframe charts. It trades a tiny amount of lag for a cleaner look — turn it off if you'd rather see the raw, stepped HTF values.
**SETTINGS**
- **General** — LTF Timeframe, HTF Timeframe, Plot Style (Line / Stepline), Visual Smoothing on/off + length
- **HTF EMAs** — toggle, length, and price source for each of the three HTF EMAs
- **LTF EMAs** — toggle, length, and price source for each of the three LTF EMAs
**NOTES**
- Pairs naturally with the other Ordinary Trader-family indicators (STRATEGY, ZONES, KEY LEVELS, FVGs). Indicatore

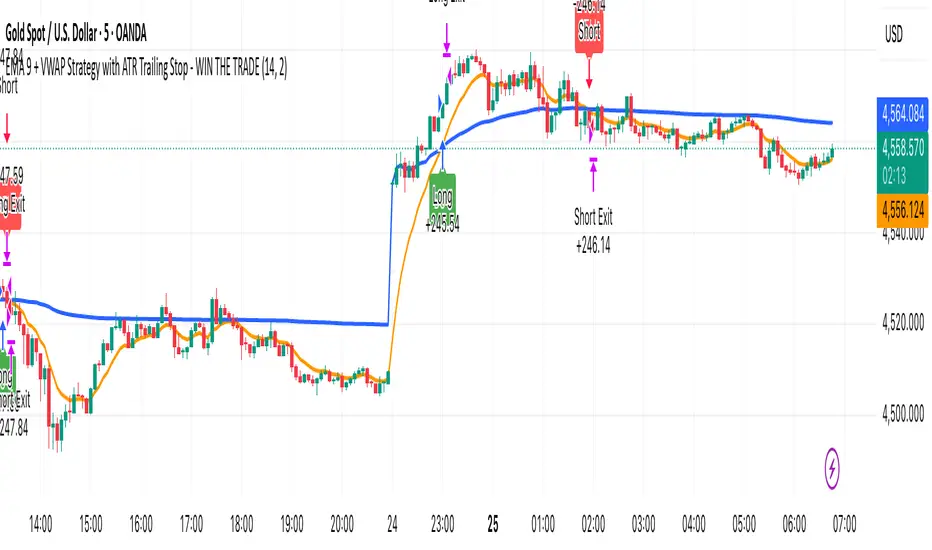
EMA 9 + VWAP Strategy with ATR Trailing Stop - WIN THE TRADEEMA 9 + VWAP Strategy with ATR Trailing Stop
A simple trend-following strategy that combines the power of the 9 EMA , VWAP , and an ATR-based trailing stop for cleaner entries and dynamic trade management.
This strategy is designed for traders who want a straightforward system with minimal discretion and clear buy/sell conditions.
Strategy Logic
Buy Conditions
A long position is opened when the 9 EMA crosses above VWAP.
Sell Conditions
A short position is opened when the 9 EMA crosses below VWAP.
Trade Management
Uses an ATR trailing stop to automatically lock in profits and manage risk. The trailing stop dynamically adjusts based on market volatility.
Features
EMA + VWAP crossover entries
ATR-based trailing stop exits
Visual BUY/SELL labels
Dynamic trailing stop lines plotted on chart
Built-in alerts
Works well for scalping, intraday trading, and trend continuation setups
Best Markets
This strategy can be used on Forex, Gold (XAUUSD), Indices, Crypto, and Stocks.
Recommended Timeframes
Popular timeframes include 1 Minute, 5 Minute, 15 Minute, and 1 Hour.
Lower timeframes generally produce more signals, while higher timeframes can provide cleaner trends.
Inputs
ATR Length controls the ATR calculation period.
ATR Multiplier adjusts the trailing stop distance.
Increasing the ATR multiplier gives trades more room to breathe, while lowering it creates tighter exits.
Alerts
The script includes ready-to-use JSON webhook alerts for automation and bot integrations.
You can connect it to trading bots, Discord alerts, Telegram alerts, trade execution systems, and prop firm automation tools.
Disclaimer
This strategy is for educational purposes only and should not be considered financial advice. Always test and optimize settings before using on a live account.
Strategia

Indicatore

Indicatore

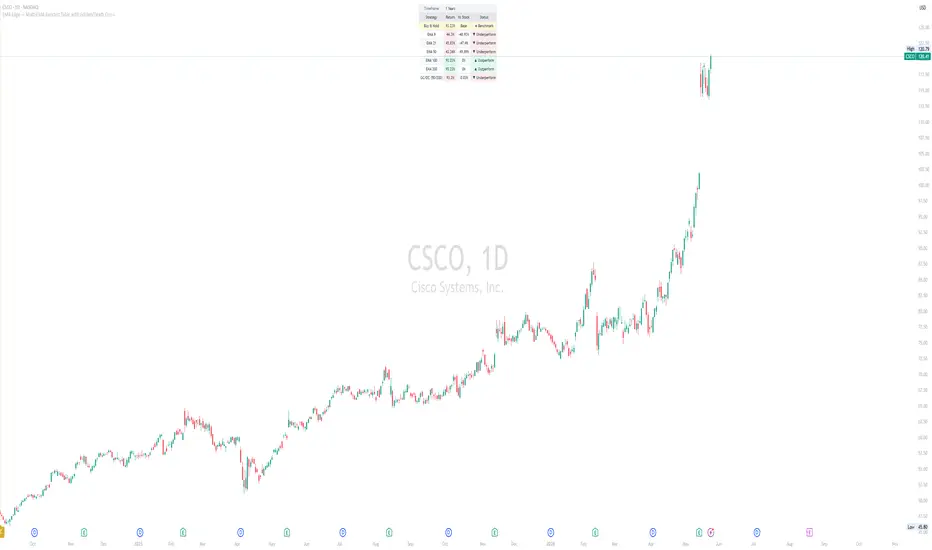
EMA Edge - Multi-EMA Backtest Table with Golden/Death CrossEMA Edge — Multi-EMA Backtest Table with Golden/Death Cross
A clean, all-in-one performance dashboard that backtests 6 long-only strategies side-by-side against a Buy & Hold benchmark — 5 single-EMA crossover strategies plus a classic Golden Cross / Death Cross strategy — with on-chart cross markers and built-in alerts.
Instead of guessing which EMA length works best for a given stock or timeframe, this indicator runs the math for you and shows the answer in a single glance, ranked against simply holding the asset.
What It Does
For each of 5 user-defined EMA lengths, the indicator simulates a simple long-only strategy:
Buy when price closes above the EMA (when flat)
Sell when price closes below the EMA (when long)
Equity starts at 100 and compounds across trades using the close-to-close return of each trade
A 6th strategy row tests the classic Golden/Death Cross:
Buy when the fast EMA crosses above the slow EMA (Golden Cross)
Sell when the fast EMA crosses below the slow EMA (Death Cross)
Special first-bar handling: if the fast EMA is already above the slow EMA at the start of your backtest window (i.e., we're mid-trend with no fresh Golden Cross to wait for), the strategy enters immediately at that bar's opening price. This avoids the unrealistic outcome of sitting in cash for years waiting for a cross that already happened.
All strategies are compared against a Buy & Hold baseline that starts at the close of the first in-range bar. If a position is open at the last bar, its equity is marked-to-market so every strategy is compared on equal terms — fully invested vs. partially invested at the cutoff.
Features
5 configurable EMAs — defaults 9 / 21 / 50 / 100 / 200, fully editable
Golden/Death Cross strategy — uses independent fast/slow EMA inputs (default 50 / 200)
Performance table showing Return %, delta vs. Buy & Hold, and Outperform / Underperform status per strategy
Flexible backtest window — X weeks, X years, or full chart lifetime
On-chart GC / DC markers with optional subtle background tint on cross bars
Built-in alerts for both Golden Cross and Death Cross events
Fully customizable table — 9 position options, 6 text sizes, all colors exposed as inputs
Soft, light color palette designed not to dominate the chart
Optional EMA plotting (off by default to keep the chart clean)
How To Read The Table
ColumnMeaningStrategyThe rule being testedReturnTotal % return of the strategy over the chosen windowVs StockDifference between the strategy's return and Buy & HoldStatus▲ Outperform if the strategy beat Buy & Hold, ▼ Underperform if not
Green-tinted rows = strategy beat Buy & Hold
Red-tinted rows = strategy underperformed Buy & Hold
Cream row = the Buy & Hold baseline itself
How To Use
Add the indicator to any chart — works on stocks, ETFs, crypto, forex, any timeframe.
Choose your backtest window (e.g., 1 Year, 5 Years, or Lifetime).
Scan the table to see which strategy historically beat Buy & Hold on this asset.
Use the on-chart GC / DC labels to spot historical and live cross events. Right-click any marker → Add Alert to be notified on new crosses.
Tip: Test the same EMA lengths across daily and weekly timeframes and across different assets. You'll usually find that what works on a steady index like SPY does not work on a volatile single stock, and vice versa. That's the entire point of the table — to make those differences visible instead of assumed.
Key Inputs
EMA 1–5: Lengths for the 5 single-EMA strategies
Show EMAs: Plot EMAs on chart (off by default)
Use Lifetime Performance: Backtest from the very first bar instead of a fixed window
Performance Timeframe Type / Value: Weeks or Years lookback
Crosses group: Toggle GC/DC display, set fast/slow EMA lengths, customize colors
Table Style group: Position, text size, background and text colors
Notes & Limitations
All strategies are long-only — no shorts, no leverage, no stops, no commissions, no slippage. This is a clean rule-based comparison, not a turnkey trading system. Live results will differ.
Entries and exits use close prices, except for the GC/DC strategy's first-bar entry when already in a golden state, which uses open.
Open positions at the last bar are marked-to-market so the comparison vs. Buy & Hold is apples-to-apples.
Past performance is not indicative of future results. Use this as a research and screening tool.
The GC/DC strategy uses separate EMA lengths from the 5 table EMAs by design, so you can run 9/21/50/100/200 in the table while still testing the classic 50/200 cross.
Alerts Available
Golden Cross: Fast EMA crossed above Slow EMA
Death Cross: Fast EMA crossed below Slow EMA
If you find this useful, a boost is appreciated. Suggestions and feedback welcome in the comments.
Open-source — feel free to study, fork, and adapt. Indicatore

Indicatore

Multi-Timeframe MA Structure & RSI ConfluenceThis indicator combines multi-timeframe moving averages, RSI-based swing structure labels, and a compact RSI confluence panel into one chart overlay.
Features:
EMA/SMA 50 and 200 for 15m, 1h, 4h, Daily and Weekly timeframes
Optional automatic hiding of lower-timeframe MAs on higher-timeframe charts
EMA/SMA visual distinction using solid and dashed lines
RSI-based swing high/low labels: HH, HL, LH, LL
Developing swings marked with “?”
Structure-based label coloring: HH/HL green, LH/LL red
Regular bullish and bearish RSI divergence labels
Compact RSI panel showing RSI value, regime, momentum, RSI vs MA, recent MA cross and recent divergence
The indicator is designed as a visual market-structure and confluence tool. It does not generate buy or sell signals and should not be used as a standalone trading system.
The swing logic is inspired by RSI overbought/oversold cycle concepts originally published by BalintDavid. Indicatore

Indicatore

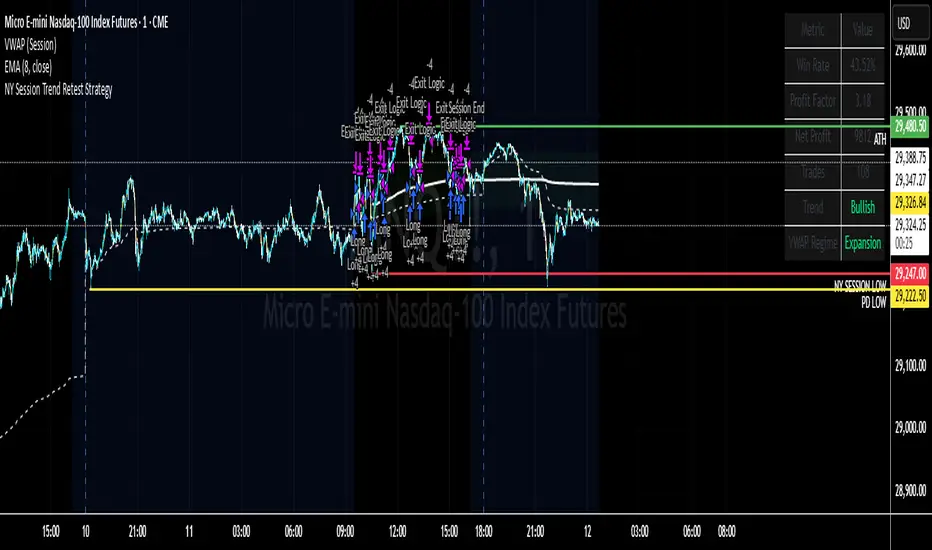
Mean Reversion at or under 200MAThis strategy is based on the 30 minute of the S&P futures chart, MES
A Long Buy will be executed if, the EMA 9 or price comes down to or under the 200 MA, AND THEN the slope of the ema 9 subsequently changes from negative to positive.
The buy will be executed either; at a retest of the local lows (defined by the lowest wick between the most recent red candle that is subsequently followed by a green candle) (a retest is defined as 70% retrace from the local highs (inversely defined from local lows) to the local lows), or if a retest of the lows fails to occur, a market order will be executed at the local highs.
With a fixed position size of 10 contracts, the take profits will be established as such; 2 contracts sold up 6 points of profit, the next two will be sold up 10 points of profit, and the remaining 2 contracts will be sold for 20 points of profit. As soon as the first trim is made, a stop loss is placed at break even. Further, as soon as the second trim is made, the stop loss will be moved to +5 profit points.
In the instance that the ema 9 returns to downward sloping, stop orders will be executed. This will trigger sells either at local lows or local highs.
Kind of just made this for a class project, but the logic is sound, and the results are formidable thus far - enjoy :) Strategia

Indicatore

Indicatore

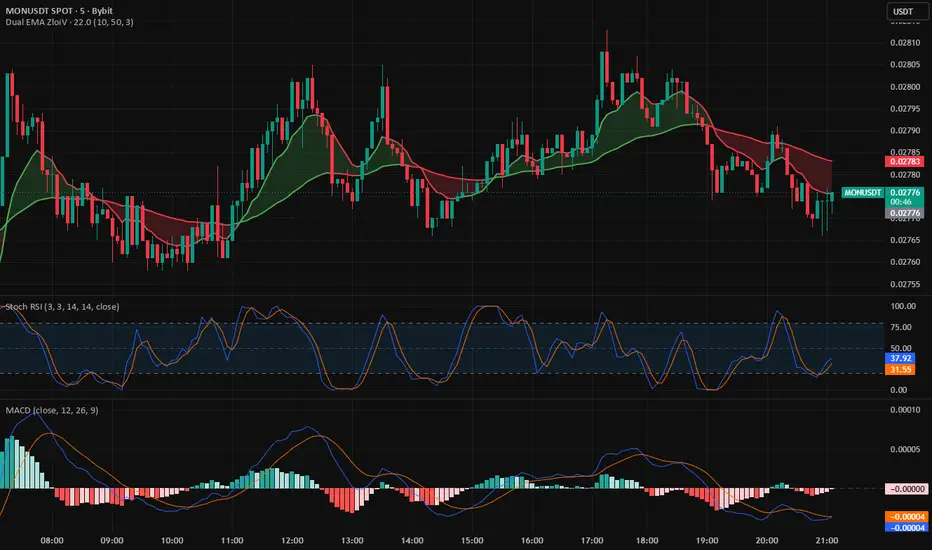
Dual EMA ZloiVOVERVIEW
Dual EMA ZloiV is a trend‑following indicator based on two exponential moving averages that color both the EMAs and the ribbon between them according to the current market direction. It is designed as a clean trend filter that quickly highlights bullish, bearish, and neutral phases without additional oscillators or visual noise.
FEATURES
Two customizable EMAs (fast and slow) with separate length and color settings for uptrend and downtrend, so you can adapt the tool to any market or timeframe.
Dynamic color change of each EMA depending on its slope and relative position, making trend shifts visually obvious on the chart.
Optional ribbon between the EMAs that reflects the overall trend direction (bullish/bearish/neutral) and helps you see momentum transitions at a glance.
Minimalistic design focused purely on trend visualization, so you can use it as a universal building block on top of your own strategies, entries and exits.
HOW TO USE
Use Dual EMA ZloiV as your primary trend filter: trade in the direction of the ribbon and EMA colors, and avoid or size down trades that go against the current trend.
Shorter EMA lengths work better for scalping and intraday trading, while longer lengths are more suitable for swing and positional setups.
Combine the indicator with your preferred entry tools (RSI, Stoch RSI, price action patterns, volume, etc.): Dual EMA ZloiV defines the direction, and other tools fine‑tune entries and exits.
LIMITATIONS
This script does not generate trade signals or execute orders; it only visualizes trend conditions based on two EMAs.
In choppy or low‑volatility markets the EMAs can frequently change color, so consider adding a separate trend/volatility filter (e.g., ADX, ATR, volume) in your system to reduce whipsaws. Indicatore

Indicatore

Indicatore

Indicatore

mbergeschI built this indicator to make my market read cleaner, faster, and more objective.
It brings together the main elements I use when analyzing momentum stocks:
• moving averages to understand trend and pace;
• benchmark comparison to see how the stock is performing against the market;
• relative strength to identify true leadership;
• tables with key information to support faster decision-making.
The goal is not to predict the future or automate the process. The goal is to reduce noise and make it easier to see when a stock is actually standing out.
For me, a good setup is not just price breaking out. It needs context: trend, relative strength, market comparison, structure, volume, and narrative.
This indicator was built around that idea: turning the chart into a cleaner and more practical decision-making dashboard for momentum trading.
Not financial advice. Just a tool for process, discipline, and better market reading.
Indicatore

Strategia

Strategia

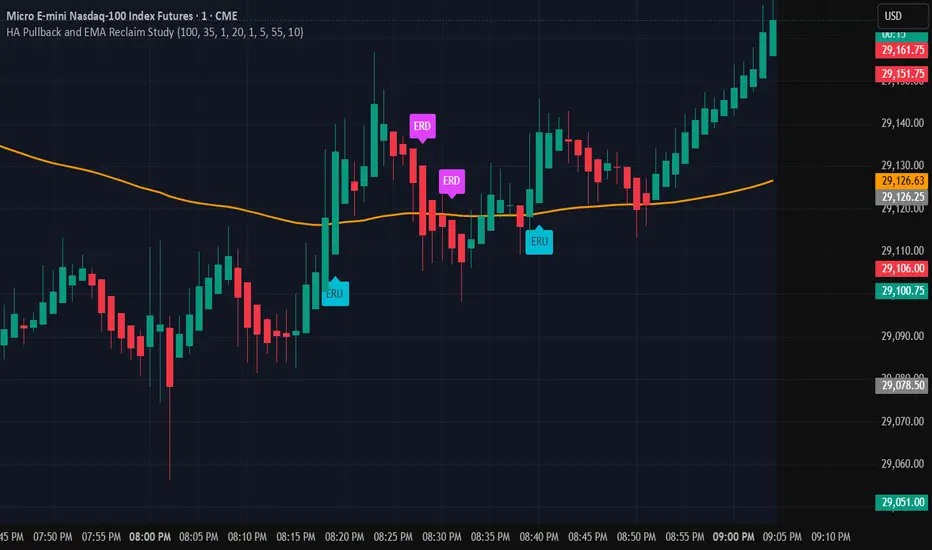
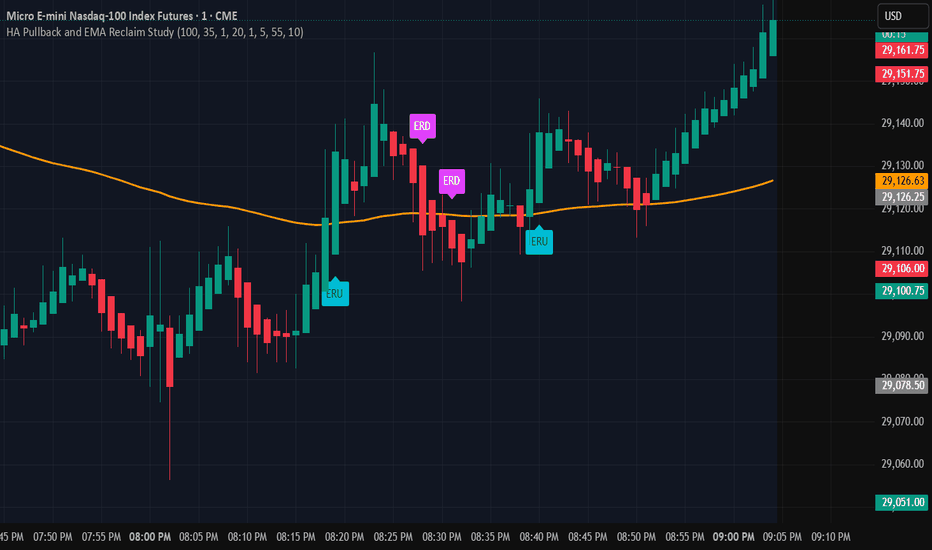
1M Scalping StrategyThis script is an educational Heikin Ashi and EMA study designed to help traders observe pullback/doji conditions and EMA reclaim behavior.
The script uses Heikin Ashi candle data together with a configurable EMA, defaulted to 100. It is designed mainly for short-term chart review and backtesting, especially on lower timeframes such as the 1-minute chart.
There are two main study conditions included:
1. HA Pullback Watch
The pullback watch condition looks for price location relative to the EMA and a specific Heikin Ashi candle sequence.
For a bullish pullback watch, the script looks for:
- Heikin Ashi price above the EMA
- Two red Heikin Ashi pullback candles
- The pullback candles having little to no upper wick
- A green doji-style Heikin Ashi candle forming after the pullback
For a bearish pullback watch, the script looks for:
- Heikin Ashi price below the EMA
- Two green Heikin Ashi pullback candles
- The pullback candles having little to no lower wick
- A red doji-style Heikin Ashi candle forming after the pullback
These conditions are marked as watch or confirmed conditions depending on whether the candle is still forming or has closed.
2. EMA Reclaim Watch
The EMA reclaim portion of the script looks for price moving from one side of the EMA to the other.
A bullish EMA reclaim condition happens when Heikin Ashi price was recently below the EMA, then pushes back above the EMA with a stronger green candle near the EMA area.
A bearish EMA reclaim condition happens when Heikin Ashi price was recently above the EMA, then pushes back below the EMA with a stronger red candle near the EMA area.
The script includes optional settings for:
- EMA length
- Doji body percentage
- Wick tolerance
- Strong candle body percentage
- EMA reclaim lookback
- EMA touch tolerance
- Volume filter
- Showing or hiding different study markers
The chart markers are intended to help users study possible pullback and EMA reclaim behavior. They are not financial advice, trade recommendations, or guaranteed buy/sell signals. Because the script uses Heikin Ashi data, users should be aware that Heikin Ashi candles are calculated candles and may not represent actual traded prices.
This script should be used for educational study, manual review, and backtesting only. Users should apply their own analysis, risk management, and confirmation before making any trading decisions. Indicatore
Trend Master Bundle (5x EMA, DEMA & VWAP) | MouryaThe Trend Master Bundle is a comprehensive, trend-following utility designed to visualize perfect moving average alignment and volume-weighted momentum. By integrating multiple exponential moving averages, a double exponential moving average, and standard deviation VWAP bands, this tool provides a clear, quantitative view of both macro trend direction and intraday mean-reversion zones.
The "Perfect Alignment" Strategy
The core algorithmic logic of this indicator detects strict momentum states where the moving averages fan out in a specific sequence:
Extremely Bullish: Identified when the current price sits above the moving averages, and the MAs are stacked in strict ascending order: 5 EMA > 10 EMA > 20 EMA > 50 EMA > 100 DEMA > 200 EMA. This structural alignment indicates a dominant uptrend.
Extremely Bearish: Identified when the price remains below the moving averages, and they are stacked in descending order: 5 EMA < 10 EMA < 20 EMA < 50 EMA < 100 DEMA < 200 EMA.
Core Indicator Components
5x Exponential Moving Averages: Standard institutional lengths (5, 10, 20, 50, 200) serve as dynamic support and resistance layers.
100-Period DEMA: The Double Exponential Moving Average is utilized to reduce the lag inherent in standard EMAs. It reacts faster to price changes, serving as a highly responsive lead indicator for mid-to-long-term trend transitions.
VWAP with Standard Deviation Bands: The anchored Volume Weighted Average Price calculates the asset's true fair value based on volume and price. The surrounding standard deviation bands help measure market volatility and extension.
Upgraded Visual Features
End-of-Line Tracking Labels: Dynamic text labels automatically track the most recent candle, floating the name of each specific moving average (e.g., "EMA 50", "VWAP") directly at the end of its respective line for instant visual identification.
Dynamic Premium Dashboard: A sleek, non-intrusive dark-mode widget provides a real-time readout of the current trend state (Extremely Bullish, Extremely Bearish, or Neutral) and lists the exact current price values for all active moving averages.
Full Customisation: Every MA length, colour, VWAP anchor, and UI element can be toggled or adjusted via the indicator settings menu to suit individual charting preferences.
Practical Application
Trend Confirmation: Traders can use the dashboard to ensure they are trading in the direction of the dominant momentum.
Pullback Entries: During a confirmed "Extremely Bullish" or "Extremely Bearish" state, the 20 EMA and VWAP baseline often act as areas of interest for trend-continuation setups.
Mean Reversion: Price interaction with the outer VWAP standard deviation bands (Bands #2 and #3) can signal statistically overextended market conditions, helping identify potential exhaustion points or mean-reversion opportunities. Indicatore

Strategia
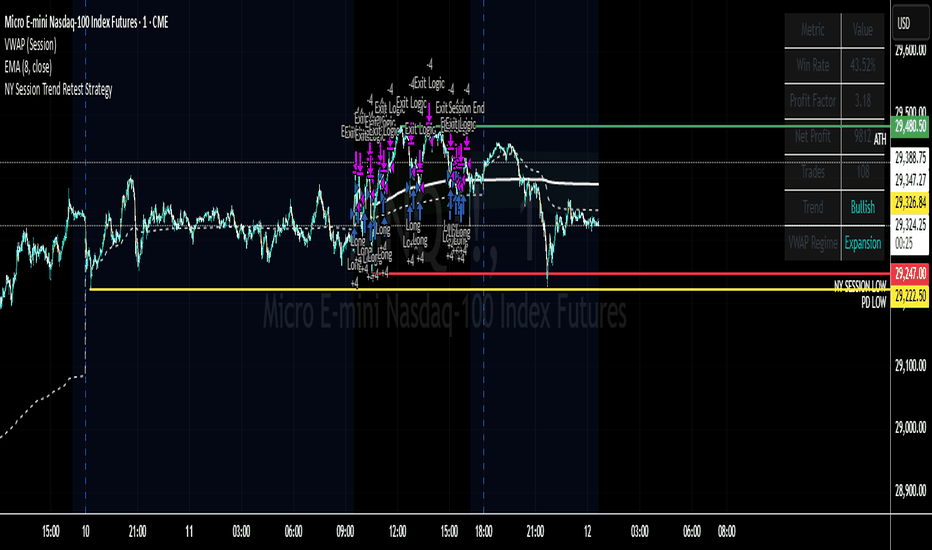
Adaptive Flow II | AnonycryptousAdaptive Flow II | Anonycryptous
Description & user manual
Why this indicator is different
Most trend-following indicators use a fixed moving average. A 50-period EMA moves at the same speed whether the market is trending hard or grinding sideways. It cannot distinguish between a clean directional move and noise. It gives the same weight to a volatile consolidation as it does to a strong impulse. The result is signals that arrive late in trends and fire repeatedly during chop.
Adaptive Flow v2 works differently.
At its core is a Kaufman Adaptive Moving Average — a moving average that measures the efficiency of price movement on every single bar and adjusts its own speed accordingly. When price is moving cleanly in one direction with low noise, the flow line accelerates toward price. When price is churning sideways with high volatility and no direction, the flow line nearly stops moving. It adapts. Automatically. Without requiring any manual intervention.
V2 builds significantly on this foundation. It adds five configurable stop modes, full market structure detection through BOS and CHoCH events, three independent signal filters, dynamic extension bands, a session-anchored VWAP, and an expanded dashboard. The result is a complete adaptive trend and structure system — not just a trend indicator, but a context-aware trading framework.
Important notice
Adaptive Flow v2 generates signals based on technical indicator alignment.
These signals are not financial advice.
They do not predict the future.
They do not guarantee profitability.
All trading decisions are made entirely by the user.
Always manage your own risk. Always apply your own judgment.
1. Overview
Adaptive Flow v2 is an adaptive trend-following indicator built around a Kaufman Adaptive Moving Average with a configurable stop engine and full market structure detection.
What it includes:
- Kaufman Adaptive Moving Average rendered as a neon glow line with four stacked plot layers
- Five stop modes: ATR Trailing, Supertrend, Chandelier, Donchian, and Volatility Pivot
- Cloud fill between the flow line and the stop line, reflecting the current trend state
- Dynamic extension bands above and below the flow line at configurable ATR distance
- BOS and CHoCH structure detection with BOS confirmation filter
- Pivot high and low target lines that change color when broken
- EMA 200 macro trend filter with higher timeframe support
- ADX filter for directional environment confirmation
- Session filter to restrict signals to a configurable trading window
- Signal cooldown to prevent repeated triggering
- Session-anchored VWAP with daily and custom session modes
- Bar coloring reflecting the current trend state
- Three presets: default, fast, and smooth
- Live dashboard with 13 data rows
- Seven alert conditions
2. The flow line — Kaufman Adaptive Moving Average
The flow line is the visual heart of Adaptive Flow. On every bar it calculates an Efficiency Ratio — a measure of how directionally efficient price movement is relative to total volatility over the lookback period.
When the Efficiency Ratio is high — price is moving strongly in one direction with low noise — the flow line accelerates toward price. When the Efficiency Ratio is low — price is ranging with high volatility — the flow line nearly stops moving.
This adaptive behavior means the flow line naturally stays close to price during strong trends and pulls away only during genuine transitions. It is not a lagging average that mechanically follows price at a fixed delay. It responds to market character.
The flow line is rendered with four stacked plot layers — a sharp core at full opacity and three progressively wider, more transparent layers behind it — creating a neon glow effect that makes it visually distinct on any chart.
The noise filter adds an additional gate: KAMA only advances when the price displacement exceeds ATR × threshold. This prevents the flow line from reacting to insignificant micro-movements during low-momentum conditions. Disable it for maximum responsiveness in strong trending environments.
3. Stop engine — five modes
The stop engine calculates a dynamic stop level from the flow line. All five modes use the flow line as their reference point, not raw price. This means the stop inherits KAMA's adaptive smoothing before calculating any distance.
When the flow line crosses the stop level, the trend flips and a signal fires.
3.1 ATR Trailing (default)
The stop trails the flow line at a fixed ATR distance using a ratchet mechanism — it only moves in the direction of the trend and locks in the floor or ceiling. This produces the characteristic smooth, flowing wave that follows the flow line closely. The cloud between the flow line and the stop gives a live view of the trend zone width. Default and recommended for most users.
3.2 Supertrend
ATR band above or below the flow line with ratchet mechanism. Similar to ATR Trailing but calculated differently, producing a more angular step-like stop line. More angular appearance, fewer intermediate flips.
3.3 Chandelier
The stop trails the highest or lowest flow line value over a configurable lookback window, then subtracts or adds ATR × multiplier. Exits when the flow line has sustained a reversal beyond the lookback range. Better for trending markets where you want to trail a historical extreme rather than the current level.
3.4 Donchian
The stop follows the highest or lowest flow line value over a rolling window with no ATR component. Purely range-based. The stop level is exactly the rolling high or low of the flow line — clean, simple, no volatility scaling.
3.5 Volatility Pivot
The stop anchors to the last confirmed pivot high or low of the flow line plus an ATR buffer. Structurally aware — the stop sits at a level where the flow line previously reversed, not at an arbitrary distance. Best for traders who want the stop to respect structure rather than trail at a fixed distance.
4. Extension bands
When enabled, two bands are drawn above and below the flow line at ATR × multiplier distance. They are not stop levels — they are extension context. When price reaches the upper band during a bullish trend, it may indicate an overextended condition. When price compresses back toward the flow line after touching a band, it may indicate a pullback area. The bands move with the flow line and adapt to current volatility.
5. Market structure — BOS and CHoCH
Adaptive Flow v2 includes a full market structure detection engine that runs alongside the adaptive trend engine.
Pivot highs and lows are detected on price using configurable left and right bar lookbacks. When price closes beyond a confirmed swing level, the indicator classifies the event as either a Break of Structure or a Change of Character.
A BOS fires when price closes beyond a swing level in the direction of the existing structural trend — confirming continuation. Drawn as a dashed line
A CHoCH fires when price closes beyond a swing level against the existing structural trend — signaling a potential reversal. Drawn as a solid line.
The BOS confirmation requirement prevents false reversals. When set to 1 (default), at least one BOS must confirm the current structural trend before a CHoCH can flip it. This blocks the common false reversal where a sharp pullback briefly closes beyond a swing level before the trend reasserts.
Pivot target lines are drawn automatically at the last confirmed pivot high and low. They extend to the right and change color when price closes through them.
6. Signal filters
Three optional filters are available. All three can be combined. A signal only fires when all active filters agree.
EMA 200 — always active as a macro filter. Bullish signals only fire above the EMA 200. Bearish signals only below. Set the EMA 200 timeframe to a higher timeframe (1H or 4H) when trading on lower timeframes — the native EMA 200 on a 1-minute chart only covers a few hours and provides no meaningful macro context.
ADX filter — when enabled, signals only fire when ADX is at or above the configured threshold. Below this level the market is typically ranging and directional signals carry less weight. Default threshold of 20 removes the weakest trend environments.
Session filter — when enabled, signals only fire during the configured trading window. Defined in HHMM-HHMM format using exchange timezone. Outside the window the flow line continues calculating but no new signals are generated.
Signal cooldown — minimum bars between two signals in the same direction. Prevents repeated triggering during choppy conditions around the stop level.
7. VWAP
The VWAP provides a volume-weighted price reference that resets at the start of each session. It represents the average price paid weighted by volume — a key reference for intraday value and institutional order flow.
Daily mode resets every calendar day. Custom mode anchors to a specific session defined by start and end times in HHMM-HHMM format. Timezone selection ensures correct boundary alignment.
8. Presets
Three preset configurations are available. Selecting a preset overrides the core KAMA calculation parameters.
Default — balanced for swing trading on 4H and daily charts.
Adaptive length 14 | Fast constant 2 | Slow constant 30 | Noise threshold 0.3.
Fast — built for scalping on 1 to 15 minute charts.
Adaptive length 6 | Fast constant 2 | Slow constant 15 | Noise threshold 0.15.
Shorter lookback for faster momentum shift detection. Lower noise threshold preserves full adaptive speed.
Smooth — designed for position trading on daily and weekly charts.
Adaptive length 21 | Fast constant 3 | Slow constant 40 | Noise threshold 0.5.
Extended lookback demands sustained momentum before accelerating. Aggressive noise filtering for high-conviction reads only.
9. Dashboard
The dashboard displays the live state of all indicator components and updates on every bar.
Rows displayed:
- Adaptive Flow — indicator name with trend-colored header and current timeframe
- Trend — current flow line direction: bullish or bearish
- Stop Mode — active stop mode in use
- Structure — current structural direction from BOS/CHoCH logic
- EMA 200 — whether price is above or below the macro filter
- VWAP — whether price is above or below session value
- ADX — current ADX value with confirmation indicator
- Session — whether the session filter is active and the current bar is inside the window
- Noise Filter — whether the noise gate is active
- Stop Distance — distance from current close to stop level in ATR multiples and as a percentage
- Trend Bars — number of bars the current trend has been active
- BOS Count — number of confirmed BOS events in the current structural direction
- Signal — last signal fired: buy, sell, CHoCH, BOS, or none
10. Settings reference
KAMA & Calculation
- Price Source: input for the flow line calculation
- Adaptive Length: efficiency ratio lookback period
- Fast Constant: smoothing speed during trending conditions
- Slow Constant: smoothing speed during ranging conditions
- Enable Noise Filter: toggle the displacement gate
- Noise Threshold: minimum ATR multiple required to advance the flow line
- Preset: Default, Fast, or Smooth
Stop Engine
- Stop Mode: ATR Trailing, Supertrend, Chandelier, Donchian, or Volatility Pivot
- ATR Length: volatility measurement period
- ATR Multiplier: distance scaling for the stop level
- Stop Lookback: rolling window for Chandelier and Donchian modes
- Pivot Buffer: ATR buffer for Volatility Pivot mode
Market Structure
- Show BOS / CHoCH: toggle structure detection
- Pivot Left / Right Bars: swing confirmation lookback
- Max Structure Levels: maximum lines shown on chart
- BOS Required Before CHoCH Flip: false reversal filter
- Show Pivot Target Lines: toggle automatic target lines
- Target Line Color and Width
Signal Filters
- EMA 200 Timeframe: leave empty for chart timeframe
- Show EMA 200: toggle line and label visibility
- EMA 200 Color
- Enable ADX Filter: toggle directional environment gate
- ADX Length and Threshold
- Enable Session Filter: toggle session-based signal restriction
- Session Window: HHMM-HHMM format
- Signal Cooldown: bars between signals
VWAP
- Session: Daily or Custom
- Timezone: UTC, Exchange, or major financial center timezone
- Session Window: for Custom mode
- Show VWAP: toggle line and label
- VWAP Color
Visuals
- Bull Color and Bear Color
- Cloud Transparency: fill between flow line and stop
- Show Extension Bands: toggle ATR extension bands
- Extension Band Multiplier: distance from flow line
- Show Reversal Signals: toggle triangle markers
- Color Candles: toggle bar coloring
- Candle Transparency
Dashboard
- Show Dashboard
- Size: Tiny, Small, or Normal
- Position: Top Left, Top Right, Bottom Left, or Bottom Right
11. How to use
11.1 Initial setup
Select a preset matching your primary trading style. Set the EMA 200 timeframe to a higher timeframe when trading on lower timeframes — 60 for 1H, 240 for 4H. Set the VWAP to Daily or configure a custom session matching your primary market. Choose a stop mode — ATR Trailing is the default and works well across all timeframes. Enable the session filter and ADX filter if you want stricter signal conditions.
11.2 Reading the chart
The flow line and its glow indicate the current adaptive trend. Green indicates a bullish environment. Red indicates a bearish environment. The cloud between the flow line and the stop shows the trend zone width — a wide cloud indicates strong momentum, a narrowing cloud indicates the flow line is slowing.
The stop line is where the trend flips. A reversal signal fires when the flow line crosses it. Triangle markers appear at the stop line at the signal bar.
Extension bands show how far price has moved from adaptive value. Price at the upper band in a bullish trend may indicate overextension. Price returning toward the flow line after touching a band may offer a pullback reference.
BOS and CHoCH lines show structural context. Use them to understand whether the trend is in a confirmation phase (BOS firing repeatedly) or approaching a potential reversal (flow line slowing while price approaches a structural level).
11.3 Timeframe guide
1 to 5 minutes — Fast preset. EMA 200 timeframe set to 60 or 240. Session filter recommended.
15 to 30 minutes — Fast or Default preset. EMA 200 timeframe 240 or D.
1 hour to 4 hours — Default preset. Native EMA 200 or D timeframe.
Daily and above — Smooth preset. Native EMA 200.
11.4 Stop mode selection guide
ATR Trailing — best for most situations. Smooth, flowing, closely follows the flow line.
Supertrend — fewer flips, more angular. Good for lower timeframe noise reduction.
Chandelier — suited for trending markets where you want to trail a recent high or low.
Donchian — clean range-based stop with no ATR influence. Simple and transparent.
Volatility Pivot — best when you want the stop at a structurally meaningful KAMA level.
11.5 Context
Adaptive Flow v2 identifies adaptive trend direction and market structure. It does not filter by fundamental events, news, or macro calendar. A bullish signal during a risk-off macro event may fail more often than one in a clear trending environment. Always apply your own context and judgment alongside the indicator output.
12. Alerts
Seven alert conditions are available:
- Bull Trend: flow line crosses above the stop level, EMA 200 above, all active filters passed.
- Bear Trend: flow line crosses below the stop level, EMA 200 below, all active filters passed.
- Any Trend Change: fires on either bull or bear trend signal.
- Bull CHoCH: market structure flips to bullish via Change of Character.
- Bear CHoCH: market structure flips to bearish via Change of Character.
- Bull BOS: bullish Break of Structure confirms trend continuation.
- Bear BOS: bearish Break of Structure confirms trend continuation.
All alerts include exchange, ticker, and interval in the message.
13. Disclaimer
This indicator is provided for educational and informational purposes only.
All outputs are based on historical price action calculations and do not guarantee future results.
Trading financial instruments involves significant risk of loss.
Past performance does not indicate future results.
Use at your own discretion.
Indicatore