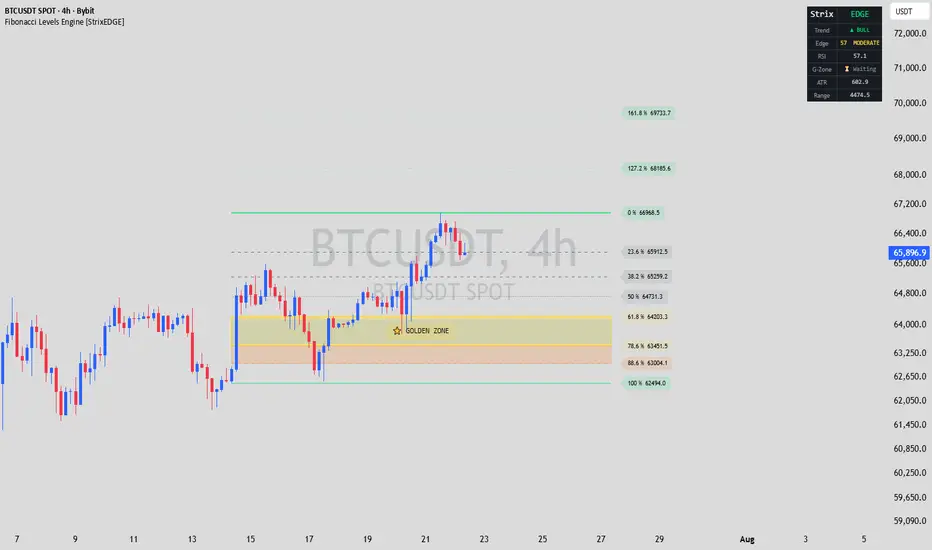
Fibonacci Levels Engine [StrixEDGE]What It Does
Fibonacci Levels Engine automatically detects the most recent swing high and swing low within a configurable lookback window, draws the standard Fibonacci retracement grid (0 %, 23.6 %, 38.2 %, 50 %, 61.8 %, 78.6 %, 88.6 %, 100 %) plus the 127.2 % and 161.8 % extensions, and projects every level into the future so you can see where price is heading relative to the structure.
What separates this indicator from a plain Fibonacci overlay is the Edge Analysis layer — three original components that work together to tell you how meaningful a given Fibonacci zone is right now, not just where it sits on the chart:
1. Edge Score (0–100) — A composite confluence gauge displayed in the dashboard.
2. Proximity Heatmap — Dynamic line opacity that makes levels glow as price approaches them.
3. ATR Volatility Band — A band around the Golden Zone midpoint that adapts to current volatility.
How It Works
Core: Swing Detection & Fibonacci Grid
The indicator scans the last N bars (default 20, configurable 5–300) to find the highest high and lowest low. It determines trend direction by comparing which extreme occurred first: if the swing low is further back in time than the swing high, the structure is bullish (price moved from low to high); otherwise it is bearish. Fibonacci ratios are then calculated from that range and drawn as horizontal levels from the swing origin to a user-defined projection length (default 30 bars into the future).
Two shaded zones highlight areas of interest:
- Golden Zone (0.618–0.786) — the highest-probability retracement area in classical Fibonacci theory.
- Deep Zone (0.786–0.886) — often the last line of defense before a full retracement.
Both zones, the 50 % midline, and the extension levels can be toggled on or off independently.
Edge Score — Confluence Gauge
The Edge Score combines three independent measurements into a single 0–100 reading:
RSI Momentum Alignment | 0–35 | In a bullish structure, a low RSI (below 35) scores highest because it signals oversold conditions near support. In a bearish structure, a high RSI (above 65) scores highest. Intermediate RSI values receive proportionally lower scores. |
| Proximity to Golden Zone | 0–35 | Measures the absolute distance between the current close and the Golden Zone midpoint as a ratio of the total Fibonacci range. The closer price is to the midpoint, the higher the score. |
| EMA Trend Alignment | 0–30 | Checks the stacking order of the 8, 21, and 55-period EMAs. A fully aligned stack (e.g., EMA 8 > EMA 21 > EMA 55 in a bullish structure) scores 30; partial alignment scores 20; misalignment scores 10. |
The resulting score is classified as STRONG (≥ 75), MODERATE (≥ 50), WEAK (≥ 25), or LOW (< 25) and displayed with a color-coded label in the dashboard. A high Edge Score means RSI, price proximity, and trend direction are all converging at the Fibonacci zone — not just that price touched a line.
Proximity Heatmap
Every Fibonacci level's line opacity is recalculated on each bar based on how far the current close is from that level. When price is near a level, the line becomes more opaque (visually brighter); when price is far away, the line fades. This is computed as a transparency value derived from the ratio of (distance to level) / (total Fibonacci range), scaled between 10 and 75. The effect lets you instantly see which levels are "active" without scanning numbers — the relevant lines stand out on their own.
ATR Volatility Band
A translucent band is drawn around the Golden Zone midpoint, extending ± 0.5 × ATR (default 14-period). This addresses a practical problem: a Fibonacci level is a single price, but real entries need a buffer that accounts for market noise. The band widens in volatile conditions and contracts in quiet ones, giving you a dynamic "fair value area" inside the Golden Zone rather than a fixed line.
Dashboard Panel
A compact table in the top-right corner of the chart displays:
- Trend — Current structural direction (Bull / Bear) with color coding.
- Edge — The composite Edge Score and its label.
- RSI — Current RSI value, color-coded for overbought/oversold extremes.
- G-Zone — Live status showing ✅ with the midpoint price when the close is inside the Golden Zone
or ⏳ Waiting when it is outside.
- ATR — Current Average True Range value.
- Range — The total Fibonacci range (swing high minus swing low).
Dashboard text size is adjustable (Tiny / Small / Normal / Large).
How to Use It
Identify the structure — Add the indicator to your chart. The dashboard immediately tells you whether the current swing structure is bullish or bearish and shows the Edge Score.
Watch the Golden Zone — When price pulls back toward the 0.618–0.786 area, check the dashboard: a high Edge Score (50+) means RSI and trend EMAs are aligned with the retracement, which increases the odds of a bounce. The G-Zone row will switch from ⏳ to ✅ when price enters the zone.
Use the Volatility Band for entries — Rather than placing a limit order on the exact 0.618 or 0.786 line, use the ATR band as your entry zone. It automatically adjusts to current volatility, giving you a wider buffer in choppy markets and a tighter one in clean trends.
Read the heatmap — Glowing lines tell you which levels price is currently interacting with. If a line is bright and the Edge Score is high, that level carries more weight. If the line is faded, price is far away and the level is not in play.
Settings Overview
- Pivot Lookback (5–300, default 20) — Number of bars scanned for swing high/low detection.
- Right Projection (5–200, default 30) — How far levels extend into the future.
- Golden Zone / Deep Zone / 50 % / Extensions — Toggle individual level groups.
- Edge Score Panel — Show or hide the dashboard.
- ATR Volatility Band — Show or hide the dynamic band.
- Proximity Heatmap — Enable or disable the distance-based line opacity effect.
- ATR / RSI Length — Periods for the ATR and RSI calculations used in the Edge Score and Volatility Band.
- Style — Full color customization for bullish/bearish, zones, bands, levels, labels, and line width.
Set alerts — Four built-in alert conditions are included:
- Price enters the Golden Zone (0.618–0.786)
- Price enters the Deep Zone (0.786–0.886)
- Edge Score reaches 75 or above (strong confluence)
- Price crosses the 0 % or 100 % level (breakout / full retracement) Indicatore

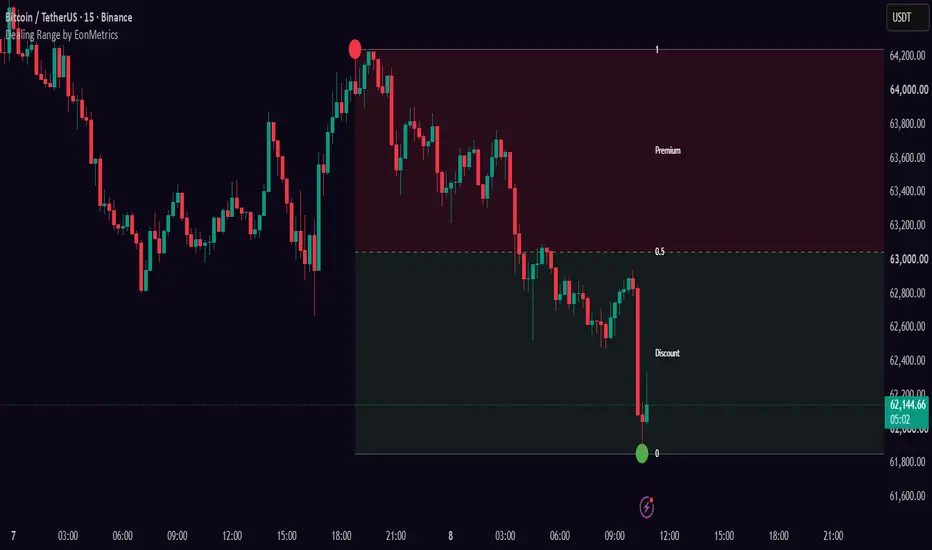
Dealing Range by EonMetricsDealing Range by EonMetrics
WHAT IT DOES
This indicator draws one box around the exact price range you're currently trading inside — from the most recent significant low up to the most recent significant high (or vice versa). It then splits that box into two halves at the exact middle: the top half is labeled "Premium" (price here is relatively expensive — a place to look for selling opportunities) and the bottom half is labeled "Discount" (price here is relatively cheap — a place to look for buying opportunities). The exact halfway line is called "Equilibrium" — a common point where price pauses or reverses.
Instead of waiting for both ends of the range to fully finish forming (which most similar tools do, and which makes the box lag behind price), one end of this box is locked to the last confirmed turning point, while the other end keeps following the live price in real time. This means the box always contains the current candle and never leaves it stranded outside — you're never looking at a stale, outdated range.
HOW TO ACTUALLY USE IT (STEP BY STEP)
1. Decide which side you want to trade, then wait for price to come to you — don't chase it in the middle of the box.
- Looking to buy (go long)? Wait for price to fall all the way down into the green Discount zone before considering an entry.
- Looking to sell (go short)? Wait for price to rise all the way up into the red Premium zone before considering an entry.
2. Once price reaches the zone you're waiting for, look for an actual trigger before entering — a reversal candle, a price gap, a small break of structure — rather than buying or selling the instant price merely touches the colored area.
3. Treat the Equilibrium (halfway) line as a "fair value" reference — price often reacts around this line before deciding its next move, so it can act as a first target or a place price pauses on the way to the far zone.
4. Watch the two dots marking the range's boundaries (0 = the low, 1 = the high) — these are the exact swing points the box is built from.
5. The box updates and can shift over time as new swings form — that's expected behavior, not a bug; it means the range is following the market's current structure.
EVERY SETTING EXPLAINED
Range Detection group
- Swing Length — how many candles on each side must be smaller/bigger for a point to count as a real turning point. A bigger number only catches major, important swings (slower-updating, bigger ranges); a smaller number catches minor ones (faster-updating, smaller ranges).
- Lock Range Until Band Break — when ON (recommended), the box stays fixed in place while price bounces around inside it, and only redraws once price actually breaks all the way out through the top or bottom. When OFF, the box updates every time a new turning point confirms, which reacts faster but can shift the box around more while you're watching it.
Visualization group
- Premium Zone — fill color of the top (expensive) half.
- Discount Zone — fill color of the bottom (cheap) half.
- Boundary Lines (0 / 1) — color of the lines marking the very top and bottom of the box.
- Show Equilibrium (50%) — turns the halfway line on or off.
- Equilibrium Color.
- Equilibrium Style — solid, dashed, or dotted line.
- Extend Right — stretches the box and lines all the way to the right edge of your chart. Turn off to have them stop at the current candle instead.
Swing Markers group
- Show Swing Points — turns on two small dots marking exactly where the box's high and low come from.
- High Swing (1) / Low Swing (0) — colors for those two dots.
Labels group
- Show Fib Levels (0 / 0.5 / 1) — labels the bottom of the box as "0", the middle as "0.5", and the top as "1" (standard reference numbers used to describe where price sits inside the range).
- Show Premium / Discount Labels — writes the words "Premium" and "Discount" inside each half.
- Show Prices — adds the actual price number next to the 0 / 0.5 / 1 labels.
- Label Position — puts the text labels on the right side (following the current candle) or the left side (where the range originally started).
- Label Text Color.
Indicatore

Indicatore

Indicatore

Optimal Trade Entry + Silver Bullet [Quantum Algo]Optimal Trade Entry + Silver Bullet
====================================================
🔶 OVERVIEW
Optimal Trade Entry + Silver Bullet is an automated ICT-style Fibonacci retracement engine that combines the Optimal Trade Entry (OTE) concept with the three Silver Bullet time windows. The indicator confirms market structure through swing highs and swing lows, detects a break of structure, automatically anchors a Fibonacci grid to the impulse leg, and highlights the 61.8% to 79% retracement zone — the Optimal Trade Entry zone — as a gradient that intensifies toward the 70.5% sweet spot. Every zone tap is graded with a transparent confluence score built from time-of-day windows, fair value gaps, and liquidity sweeps.
The goal is simple: remove the two biggest sources of error in discretionary Optimal Trade Entry trading — anchoring the Fibonacci retracement to the wrong leg, and taking entries outside the hours when the model statistically performs.
🔶 WHAT IS THE OPTIMAL TRADE ENTRY ZONE?
The Optimal Trade Entry is a smart money concept describing the discount (in an uptrend) or premium (in a downtrend) portion of an impulse leg where institutional participants typically complete their entries after a trend has been confirmed. It is defined as the area between the 61.8% and 79% Fibonacci retracement of the most recent impulse, with the 70.5% level acting as the statistical sweet spot. Price retracing into this zone after a break of structure offers a defined-risk entry: the stop belongs beyond the origin of the leg, and the targets project into the extension levels beyond the impulse extreme.
🔶 WHAT ARE THE SILVER BULLET WINDOWS?
The Silver Bullet model restricts trading to three specific one-hour windows in New York time, when algorithmic price delivery is most likely to seek liquidity and fill fair value gaps:
- London Open window — 03:00 to 04:00
- New York Morning window — 10:00 to 11:00
- New York Afternoon window — 14:00 to 15:00
This indicator shades each window on intraday charts, labels the window open, and treats window activity as a scoring input: an Optimal Trade Entry tap that occurs inside an active window grades higher than one that occurs outside it.
🔶 WHY THIS SCRIPT IS ORIGINAL
1. Pivot-and-shift automatic anchoring. The Fibonacci grid is never drawn from arbitrary pivots and never requires manual anchoring. It appears only after price closes through a confirmed swing point — a genuine break of structure — and anchors to the true origin of the impulse leg.
2. Dynamic leg stretching. While the trend continues printing new highs or new lows, the grid stretches with the market in real time, so the retracement zone is always measured against the current, mathematically complete leg — not a stale one.
3. Time-based signal qualification. The Silver Bullet windows are not decorative background shading. They are wired directly into the signal engine and the grading model, which is what separates this tool from a standard Fibonacci retracement indicator.
4. Transparent confluence grading. Every signal receives a grade of A+, A, B, or C based on four observable, verifiable conditions: entry zone tap, active Silver Bullet window, directional fair value gap formed inside a window on the current leg, and a liquidity sweep at the leg origin (the anchor pivot running the stops beyond the pivot before it). Nothing is hidden, nothing is repainted, and nothing is curve-fit.
🔶 HOW IT WORKS
Market structure engine: Swing highs and swing lows are confirmed with a symmetric pivot lookback. A candle close above the last confirmed swing high shifts the engine bullish; a close below the last confirmed swing low shifts it bearish. All signals are evaluated on closed bars only, so entries do not repaint.
Fibonacci retracement grid: On each break of structure the impulse leg is measured from the anchor pivot to the running extreme. The script plots the origin (1.0), equilibrium (0.5), the entry zone borders (0.618 and 0.79), the sweet spot (0.705, dotted), the impulse extreme (0.0), and two target extensions (default -0.27 and -0.62).
Entry zone gradient: The zone between 0.618 and 0.79 renders as four stacked slices whose opacity increases toward the 0.705 sweet spot, giving an immediate visual read of where the highest-probability fill sits.
Fair value gap engine: Three-candle imbalances that clear a minimum size threshold (measured against average true range) are boxed on the chart. By default only gaps forming inside an active Silver Bullet window are drawn, and every gap grays out automatically once price mitigates it, keeping the chart clean.
Liquidity sweep detection: When the anchor pivot of a new leg trades through the pivot before it — sell-side liquidity taken before a bullish leg, or buy-side liquidity taken before a bearish leg — the setup is flagged as a sweep and grades higher.
Trade plan projection: When price taps the entry zone and passes the active filters, the script prints a graded signal marker plus Entry, Stop (beyond the leg origin with an average-true-range buffer), Target One, and Target Two, each labeled with its exact price.
Dashboard: A compact panel tracks directional bias, live retracement percentage, entry zone status, sweet spot price, the active Silver Bullet window, fair value gap confluence count, and liquidity sweep status at a glance.
🔶 HOW TO USE IT
1. Apply the indicator to an intraday chart. One-minute to fifteen-minute timeframes suit the Silver Bullet windows best; the Fibonacci engine itself works on any timeframe.
2. Wait for the dashboard bias to flip after a break of structure.
3. Let price retrace. The dashboard shows the live retracement percentage as price approaches the Optimal Trade Entry zone.
4. The strongest setups tap the gradient inside an active Silver Bullet window after a liquidity sweep, with a fair value gap in the direction of the leg — that is the A+ profile.
5. Use the printed Entry, Stop, and Target levels as reference geometry, then apply your own position sizing and risk management.
6. Tighten or relax the engine with the two signal filters: Require Active Silver Bullet Window and Require Fair Value Gap Confluence.
🔶 SETTINGS
- Swing Detection Length — pivot lookback controlling structure size; higher values track larger legs.
- Completed Setups To Keep, Fair Value Gaps To Keep, Trade Plans To Keep — cap how many historical drawings remain, so the chart stays clean and the auto-scale stays anchored to current price.
- Independent toggles for each Silver Bullet window, the Fibonacci grid, the zone gradient, equilibrium, targets, and the dashboard.
- Fully customizable colors and dashboard position.
🔶 ALERTS
- Bullish Optimal Trade Entry — price tapped the bullish zone and passed the active filters.
- Bearish Optimal Trade Entry — price tapped the bearish zone and passed the active filters.
- Silver Bullet Window Opened — one of the three windows just began.
🔶 FREQUENTLY ASKED QUESTIONS
Does the indicator repaint? Entries are evaluated on closed bars only. Swing pivots require confirmation by design, which introduces intentional lag but keeps historical signals fixed.
Which markets does it work on? Any symbol with candle data — cryptocurrency, forex, gold, indices, stocks, and futures. The Silver Bullet windows reference New York time regardless of your chart timezone.
Which timeframe is best? The Silver Bullet windows require an intraday chart (sixty minutes or below). The one-minute to fifteen-minute range is the classic application; the Optimal Trade Entry engine alone also functions on higher timeframes.
What does the grade mean? It is a count of observable confluences (zone tap, window, gap, sweep) — a transparency tool, not a win-rate prediction.
🔶 LIMITATIONS
Pivot confirmation is intentionally delayed by the swing length, so the engine describes confirmed structure rather than predicting it. Retracements can exceed the zone and invalidate the leg during strong counter-moves. Grades measure confluence, not probability of profit. No indicator replaces independent analysis.
🔶 DISCLAIMER
This script is provided strictly for educational and informational purposes. It is not financial advice, an investment recommendation, or a solicitation to buy or sell any financial instrument. Past behavior of any level, time window, or signal does not guarantee future results. Trading involves substantial risk. Always do your own research and manage risk independently. Indicatore

Scalp The ReactScalp The React (STR) is an advanced, all-in-one market structure and liquidity mapping framework. Designed for scalpers, intraday traders, and swing traders, this indicator dynamically builds actionable "Reaction Zones," Fibonacci projection targets, and liquidity sweep setups based on real-time market structure breaks and session timings.
Instead of relying on static, manual drawings, STR automatically identifies structural pivots, determines the market bias, and projects forward-looking target zones to give you a complete roadmap of where the price is likely to react.
🌟 Core Features & Modules
1. Dynamic Fibonacci Setup Modes
The heart of STR is its adaptive Fibonacci projection engine. Depending on your trading style, you can choose how the indicator anchors its High/Low legs to draw the target zones.
Scalp Mode: A step-by-step approach. It waits for the current 0 or 1 boundaries of the active setup to be completely broken before anchoring a new Fibonacci leg.
Intraday Mode: Focuses purely on trend reversals. It maps new Fibonacci projection zones only when a Change of Character (CHoCH) occurs.
HTF (Higher Timeframe) Mode: Top-down analysis made easy. It grabs the exact High and Low of the previous Higher Timeframe candle (e.g., 4H) and projects intraday zones based on that HTF range.
Session Mode: Perfect for session-to-session liquidity traders. It automatically tracks the High and Low of specific trading sessions (Asia, London, New York). The moment a session ends, it instantly projects the Fibonacci scheme based on the current market bias. (Labels explicitly tell you if a level is the "Asia High" or "London Low").
First 4H Mode: An opening range breakout approach. It maps the High and Low of the day's first 4 hours (e.g., 03:00 - 07:00) and projects the roadmap for the rest of the day.
2. Target & Liquidity Zones
Whenever a new setup is confirmed, the indicator plots highly specific mathematical zones:
Magnetic Retest Level (0.5): The fair-value equilibrium of the anchor leg.
Reaction Zone (1.47 - 1.55): The primary Take Profit and reaction box.
External Reaction Zone (2.56 - 2.64): The extended macro target box.
Liquidity Sweep Box (-0.21 to -0.29): Placed exactly opposite to the breakout direction. If the price pushes into this zone and closes back inside the range, the indicator marks a precise Sweep (x) label, signaling a potential liquidity trap / reversal.
3. Market Structure Engine (BOS & CHoCH)
The script continuously scans for fractal highs and lows. It draws "Candidate" levels and waits for the price to break them (wick or body close based on your preference). Once broken, it permanently stamps the chart with BOS (Break of Structure) or CHoCH (Change of Character) labels and lines, keeping a clean historical record of the trend state.
4. Kinetic MA Trail & Bias Engine
To avoid plotting setups against the broader trend, the indicator uses a "Kinetic MA." This is a macro moving average that trails the price uniquely by filtering out noise using Supertrend and ATR logic.
When the price is above the Kinetic MA, the macro bias is Bullish.
When the price is below the Kinetic MA, the macro bias is Bearish.
Note: This internal bias is what dictates the direction of the Session and First 4H Fibonacci projections.
5. Advanced FVG / Breaker Engine
A built-in Fair Value Gap (FVG) and Breaker block extraction module.
Displays the last N unmitigated gaps.
Overlap Filter: Automatically hides overlapping FVGs to keep the chart incredibly clean.
Raid Detection: Marks an "x" inside the gap if the price aggressively wicks into it (a liquidity raid) but fails to close beyond it.
Supports mitigation filtering by Wick, Body Close, or Average line.
⚙️ How to Use It?
Select your Mode: If you trade the London/New York overlaps, set the Fib Mode to "Session". If you are a pure price-action scalper, set it to "Scalp" or "Intraday".
Follow the Liquidity: Look for setups where the price breaks structure, pulls back into the yellow Magnetic Level (0.5), or sweeps the Red Liquidity Box (-0.21 to -0.29) before targeting the Green Reaction Zones.
Align with the Kinetic MA: Use the glowing Kinetic MA band to stay on the right side of the macro trend.
⚠️ Disclaimer
For Educational Purposes Only:
The "Scalp The React" indicator and all its built-in features (including Fibonacci zones, market structure labels, moving averages, and FVG detection) are provided strictly for educational and informational purposes.
Not Financial Advice:
This script does not constitute financial advice, investment recommendations, or a solicitation to buy or sell any financial instruments. Trading in financial markets (including cryptocurrencies, forex, stocks, and commodities) involves a high degree of risk and may not be suitable for all investors. You could lose some or all of your initial investment.
No Guarantee of Results:
Past performance of any trading system or methodology is not necessarily indicative of future results. The zones, labels, and signals generated by this script are based on mathematical formulas and historical price action; they do not predict the future.
User Responsibility:
By using this script, you acknowledge that you are solely responsible for your own trading decisions. Always conduct your own research (DYOR), practice strict risk management, and consult with a certified financial advisor before making any trading or investment decisions. The author of this script assumes no responsibility for any trading losses incurred. Indicatore

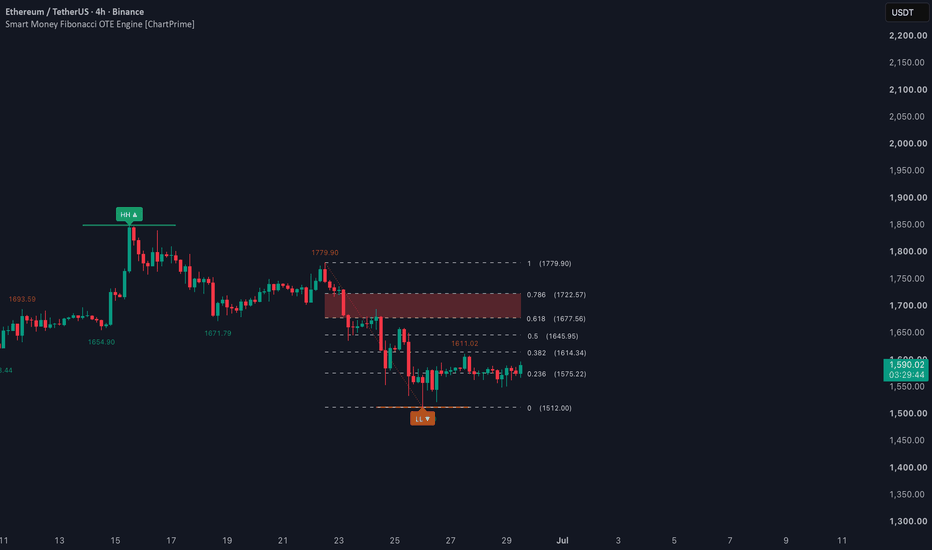
Smart Money Fibonacci OTE Engine [ChartPrime]🔶 OVERVIEW
In the world of Smart Money Concepts (SMC), finding a "cheap" or "expensive" price is not enough—you need to find the Optimal Trade Entry (OTE). The Smart Money Fibonacci OTE Engine is an automated structural analysis tool that identifies trend shifts and projects institutional retracement zones in real-time.
Unlike traditional Fibonacci tools that require manual drawing, this engine detects Break of Structure (BOS) events and automatically anchors a Fibonacci grid to the most relevant swing points. It specifically highlights the OTE zone, where institutional buying or selling typically occurs after a trend confirmation.
🔶 CORE MECHANICS: AUTOMATED ANCHORING
The engine operates on a sophisticated "Pivot and Shift" logic:
Swing Detection: The script monitors price for structural Swing Highs and Swing Lows based on your chosen pivot length.
Fibonacci Direction Shift Recognition: A direction shift is confirmed when pivot price exceeds the previous Swing Pivot High (Higher High), and a down direction shift is confirmed when price drops below the previous Swing Pivot Low (Lower Low).
Dynamic Stretching: Once a direction is established, the Fibonacci grid "breathes" with the market. If the trend continues to make new highs or lows, the grid automatically stretches to include the new extension, ensuring your retracement levels are always mathematically accurate.
🔶 THE OPTIMAL TRADE ENTRY (OTE) ZONE
The OTE zone is the primary focus of this indicator. Based on ICT (Inner Circle Trader) concepts, the OTE represents the "sweet spot" of a retracement.
The Range: By default, the zone is plotted between the 0.618 and 0.786 Fibonacci levels.
Institutional Discount/Premium: In a bullish trend, price retreating into the OTE zone is considered "buying at a discount." In a bearish trend, a rally into the OTE is "selling at a premium."
Visual Clarity: The zone is highlighted with a colored box (teal for bull, red for bear), making it easy to identify exactly where to look for price action reversal signals.
🔶 KEY VISUAL FEATURES
Structure Labels: Automatically marks HH (Higher High) and LL (Lower Low) points with Break-of-Structure (BOS) lines.
Swing Diagonal: A dotted line connects the two anchor points of the Fibonacci grid, providing a clear visual representation of the current swing's slope and magnitude.
Extended Levels: Horizontal Fibonacci lines (0.236, 0.382, 0.5, etc.) are projected across the chart, with price-sensitive labels that update every tick.
Historical Mode: Toggle "Show Previous Fibs" to see where past OTE zones were respected, helping you backtest the current asset's adherence to Fibonacci levels.
🔶 INDICATOR INPUTS
Pivot Length: Adjust this to filter between micro-structure (short length) and macro-structure (long length).
OTE Upper/Lower Levels: Fully customizable boundaries for your entry zone.
Visual Styles: Change line styles (Solid, Dashed, Dotted) and colors for the grid, labels, and structure shifts to match your chart theme.
🔶 TRADING UTILITY
High-Probability Entries: Instead of "chasing" a breakout, wait for the Smart Money Fibonacci Engine to identify the higher high or lower low, then wait for price to return to the OTE box.
Confluence Tool: Use the OTE zone in conjunction with Order Blocks or Liquidity Sweeps. When an OTE zone aligns with a previously swept EQL or EQH, the probability of a reversal increases significantly.
Objective Profit Taking: Use the 0.0 (origin) and various extension levels as objective targets for scaling out of positions.
🔶 CONCLUSION
The Smart Money Fibonacci OTE Engine removes the subjectivity from drawing Fibonacci retracements. By automating the detection of market structure and highlighting the most statistically relevant entry zones, it allows traders to focus on execution rather than chart drawing. Indicatore
Elliott Wave Scanner [MarkitTick]💡 An automated structural analysis tool engineered to detect, classify, and visualize complex market cycles based on classic wave progression principles. By scanning localized price extrema and passing them through a rigorous matrix of geometric and proportion-based filters, this indicator distills highly subjective chart analysis into objective, rule-based pattern recognition. Designed for traders who rely on structured market phases, the scanner not only maps five-wave impulses and three-wave corrections but also integrates dynamic risk-to-reward calculations, volume confirmation, and higher-timeframe alignment to evaluate the probabilistic quality of every structural sequence it identifies.
✨ Originality and Utility
Wave theory is traditionally plagued by subjectivity and observer bias, where two analysts might map entirely different structures on the same chart. The utility of this script lies in its strict, algorithmic standardization. It removes emotional interpretation by requiring market swings to conform to precise mathematical tolerances before a sequence is validated.
This tool distinguishes itself by moving beyond mere drawing utilities. It is a complete analytical environment that actively assesses the viability of a market structure. It calculates a predefined Risk-to-Reward (R:R) ratio, establishes a clear target, and sets a protective invalidation level for every valid formation. Furthermore, it incorporates confluence filters—such as market structure midlines and higher-timeframe directional bias—ensuring that localized patterns are only presented when they align with the broader macroeconomic flow. This multifaceted approach provides a systematic, highly actionable framework rather than a simple visual overlay.
🔬 Methodology and Concepts
The core engine of this scanner is built upon the identification of sequential market pivots and the subsequent validation of their relationships through Fibonacci retracement and extension parameters.
• Algorithmic Pivot Detection
The script continuously monitors price action to identify localized peaks and troughs, referred to as Pivot Highs and Pivot Lows. A pivot is mathematically confirmed only when a central price point is surrounded by a user-defined number of lower highs (or higher lows) on both its left and right sides. This ensures that only significant market turning points are evaluated, filtering out intraday noise.
• Impulse Validation (1-2-3-4-5)
To confirm a five-wave impulse, the script isolates an alternating sequence of six confirmed pivots and applies strict proportional rules:
Wave 2 must retrace between 38.2% and 78.6% of Wave 1.
Wave 3 must extend beyond the terminus of Wave 1 and mathematically cannot be the shortest wave in the 1-3-5 sequence.
Wave 4 must retrace between 23.6% and 50.0% of Wave 3.
The script enforces an optional but standard rule where the extreme of Wave 4 must not overlap the extreme of Wave 1.
• Correction Validation (A-B-C)
For three-wave corrective structures, the engine isolates a sequence of four alternating pivots:
Wave B is required to retrace between 38.2% and 78.6% of the initial Wave A sequence.
Wave C must form a proportional extension of Wave A, operating strictly between the 61.8% and 161.8% boundaries.
• Structural Confirmation and PRZ
Once geometric rules are satisfied, the script calculates a Potential Reversal Zone (PRZ). For an impulse, the PRZ represents the logical termination area for Wave 5, derived by projecting 100% to 161.8% of Wave 1's magnitude outward from the origin of Wave 5. The entire sequence is then subjected to a Risk:Reward calculation, validating the pattern only if the theoretical trade setup meets the required profitability threshold.
🎨 Visual Guide
The indicator is designed to provide maximum data density without cluttering the charting environment.
• Structural Pathing
Valid Impulse waves are rendered using robust, continuous lines connecting the validated pivots, clearly demarcating the 1-2-3-4-5 progression. Corrective A-B-C structures are rendered in a distinctly contrasting color, providing immediate visual differentiation between trending and counter-trend market phases.
• Fibonacci Anchor Lines
Dotted horizontal projection lines extend outward from the Wave 4 terminus, visually indicating the 1.0x, 1.618x, and 2.618x Fibonacci extensions of Wave 1. These serve as dynamic targets for Wave 5 completion.
• Potential Reversal Zone (PRZ)
A shaded, transparent box is drawn at the culmination of the pattern. This box highlights the specific price region where harmonic and Fibonacci projections converge, signifying the highest probability area for the pattern's completion and subsequent market reversal.
• Trade Parameters
Upon pattern completion, three distinct dashed lines are projected forward on the chart:
An Entry line, anchored at the final wave's closing extreme.
A Stop line, calculated dynamically using an Average True Range (ATR) buffer applied to the penultimate structural pivot.
A Target line, mathematically derived from a 61.8% proportional measurement of the dominant impulsive wave.
• The Analytical Dashboard
A comprehensive data table anchors to the top right of the screen. This dashboard tracks real-time system metrics, including the prevailing market bias, the active pattern type, exact price levels for the generated trade parameters, and a dynamic Risk:Reward quality score visualized via an integrated block-bar system. It also tracks historical pattern frequency and individual wave magnitudes.
📖 How to Use
This script is engineered to act as an objective entry generation tool based on wave completion.
• Trading the Impulse W5
When the scanner identifies a validated 1-2-3-4 progression and projects the final Wave 5 into the PRZ box, traders should monitor price action within this shaded region. A rejection or stabilization within the PRZ, accompanied by the printing of the Entry, Stop, and Target dashed lines, signals a valid execution window. The structural stop-loss ensures that if the wave count is invalidated by overlapping previous structure, risk is immediately contained.
• Trading the A-B-C Correction
Corrective sequences are utilized to position into the resumption of the primary trend. When an A-B-C sequence completes, indicating that the counter-trend exhaustion has been reached, the system will output actionable levels targeting the previous macro swing high or low. Traders can utilize the volume confirmation toggle to ensure that the reversal away from the Wave C terminus is supported by institutional participation.
• Managing Pivot Delay
Because the indicator relies on confirmed pivots (requiring a set number of bars to close on the right side of the extreme), signals are generated only after the structural turning point is mathematically locked. Traders should view the generated Entry line as the execution threshold, waiting for price to retest or confidently cross this parameter rather than attempting to guess the absolute bottom or top of the raw price action.
⚙️ Inputs and Settings
The indicator offers deep modularity, allowing adaptation across different asset classes and timeframes.
• Pivot Configurations
Adjusting the Pivot Left and Pivot Right parameters alters the sensitivity of the extrema detection. Lower values yield aggressive, micro-wave tracking suitable for scalping, while higher values isolate macro-economic market cycles.
• Elliott Rules and Tolerances
The Fib Tolerance (%) input allows the user to expand or contract the leniency of the retracement measurements. The system also includes logical toggles to enforce strict structural laws, such as ensuring Wave 4 never overlaps Wave 1, or that Wave 3 must explicitly extend beyond Wave 1.
• Filter Systems
Traders can enforce a Higher Timeframe (HTF) Bias , ensuring the script only plots bullish waves when the macro trend is positive. A Volume Confirmation toggle is also available, suppressing signals if the momentum behind Wave 3 fails to breach the baseline volume moving average.
• Visual and Dashboard Toggles
Every graphical element, from the PRZ shading to the individual wave labels, can be toggled on or off to maintain chart hygiene. The dashboard can also be customized with specific text and background colors to fit any chart template.
🔍 Deconstruction of the Underlying Scientific and Academic Framework
The foundational framework of this indicator is deeply rooted in fractal geometry and the statistical behavior of financial time series. Markets, much like natural phenomena, exhibit self-similarity across different scales—a concept heavily explored in the mathematics of fractional Brownian motion. This indicator applies this academic premise by assuming that macroeconomic trending phases (impulses) and mean-reverting phases (corrections) manifest in predictable, repeating geometric sequences, regardless of the timeframe observed.
At the core of the algorithm is the algorithmic isolation of local extrema. By utilizing a rolling array of historical price highs and lows, the engine establishes a localized topology of the market. This topology is then subjected to proportional analysis governed by the Fibonacci sequence, a mathematical series intimately connected to the golden ratio (1.618). In financial econometrics, these specific ratios function as a psychological boundary mechanism; because market participants aggregate their risk and take-profit parameters around these proportional extensions, they generate measurable zones of supply and demand clustering.
The script synthesizes these disciplines by requiring that the distance between consecutive topological extrema strictly conforms to these irrational proportions. By enforcing a rule set where localized wave measurements must divide into one another to produce specific golden ratio derivatives, the indicator successfully models the non-linear, oscillatory nature of crowd psychology and market liquidity into a rigid, computable output.
⚠️ Disclaimer
All provided scripts and indicators are strictly for educational exploration and must not be interpreted as financial advice or a recommendation to execute trades. We expressly disclaim all liability for any financial losses or damages that may result, directly or indirectly, from the reliance on or application of these tools. Market participation carries inherent risk where past performance never guarantees future returns, leaving all investment decisions and due diligence solely at your own discretion. Indicatore

Smart Trap StructureSmart Trap Structure (STS)
The Smart Trap Structure (STS) is an advanced institutional and structural trading indicator designed to filter out market noise, identify deep liquidity hunts (traps), and track the true directional intent of the market.
Unlike standard market structure scripts that clutter the chart with endless BOS (Break of Structure) and CHoCH (Change of Character) labels, STS utilizes an exclusive "Active Setup Cycle" logic. This ensures that you only see the most relevant price ranges and confirmation points for the current market phase.
Key Features:
The Decision Line (Orange Retest Line):
Whenever a valid CHoCH occurs, an active orange "Decision Line" is projected forward. This line acts as the ultimate truth for the setup. If price violently pierces this line, it is often hunting for stop-losses (Smart Money Trap) before continuing in the intended direction.
Reaction Zones (HH & LL Boxes):
Instead of just drawing wicks, STS dynamically maps the extreme Highest Highs (HH) and Lowest Lows (LL) of a confirmed structural phase using shaded Reaction Zone boxes (from the absolute wick to the body). These zones act as highly reactive supply and demand areas for future retests.
Dynamic Fibonacci Engine:
STS features a built-in Fibonacci drawing tool that automatically anchors to the confirmed extremes (HH to LL or LL to HH) of the active setup phase. It perfectly projects structural retracement and extension levels (0, 0.236, 0.382, 0.618, 0.764, 1.0, 1.382, 1.618). When Fibo mode is active, it automatically hides unnecessary historical dotted lines for maximum chart clarity.
Clean Chart Mechanics:
You will never suffer from "indicator fatigue". When the structure shifts, the indicator forcefully deletes old, irrelevant lines, reaction boxes, and labels from past cycles. Only the active CHoCH label remains standard-sized, while internal BOS events are scaled down to keep your chart visually clean.
Integrated MA & VWAP:
Toggle the built-in VWAP and select from a variety of Moving Averages (SMA, EMA, WMA, HMA, VWMA) straight from the settings without needing an extra indicator slot on your chart.
Disclaimer:
This script is provided for educational and analytical purposes only. Past performance does not guarantee future results. The script does not constitute financial advice. Always use proper risk management and execute trades based on your own comprehensive market analysis. Indicatore

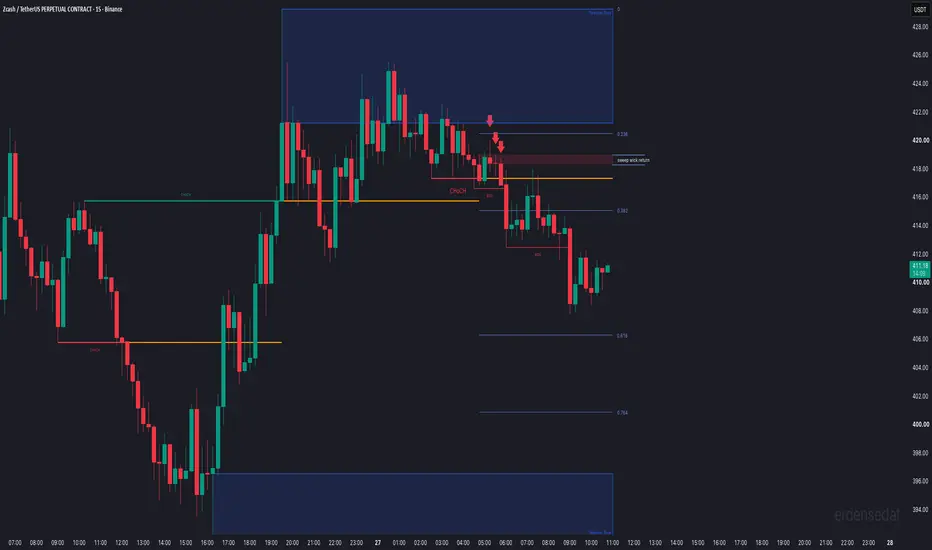
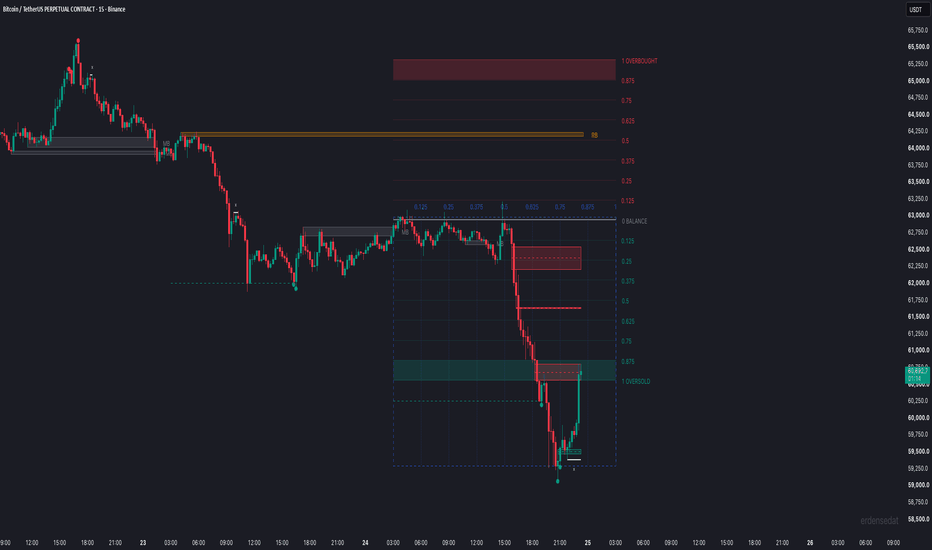
Time and Price by erdensedatTime & Price Institutional Toolkit
Overview
The Time & Price Institutional Toolkit is an advanced framework designed to bridge the concepts of time cycles and price action liquidity. By blending multi-timeframe structural analysis, mathematical models (Fibonacci, Gann, Quarterly), and fair value gaps (FVG), it provides a complete top-down perspective on institutional order flow.
The "Blue Skeleton" & Liquidity Sweeps
At the core of the script is the dynamic "Blue Skeleton" matrix. It draws the calculation period's highest, lowest, and equilibrium points.
Liquidity Sweep Filter: The skeleton essentially maps the "playing field" for the current session.
Time Element: As time passes the 0.5 (midpoint) of the skeleton box—often aligning with the overlap of the London and New York sessions—the indicator is highly sensitive to manipulation sweeps. If the price spikes out of the skeleton boundaries after this midpoint, it frequently marks a "Turtle Soup" manipulation reversal right before a heavy volume trend kicks in.
Key Features:
1. Time & Price Matrix (Skeleton Framework)
Dynamically maps premium/discount zones and equilibrium based on your chosen higher timeframe (e.g., Daily, Weekly).
Multiple mathematical schemas available: Mixed, Fibonacci, Quarterly, and Gann/Harmonic ratios.
Clearly plots Overbought/Oversold extremes.
2. Turtle Soup (TS) Entry Model
Identifies liquidity sweeps below previous period lows (Bullish Sweep) or above previous period highs (Bearish Sweep) that occur in the critical second half of the time window.
Visualized with custom dashed lines and circular markers indicating high-probability reversal zones.
3. Fair Value Gap (FVG) & Breaker Engine
Automatic detection of Fair Value Gaps and Breaker Blocks with overlapping gap filters.
Raid Displays: Shows when an FVG has been raided (swept and closed through), creating dynamic support/resistance lines marked with an 'x'.
Adjustable mitigation thresholds (Close, Wick, or Average).
4. Rejection Blocks
Highlights extreme wicks (where the wick is greater than 50% of the candle range) that signify rejection.
These act as institutional pivot points. Once mitigated, they visually transform into Mitigated Blocks (MB).
5. VWAP (Volume Weighted Average Price)
Built-in, optional VWAP line for intraday mean-reversion and dynamic trend confirmation (Disabled by default, can be toggled in settings).
6. Candle Structure & Reversal Formations
(Optional feature in settings) Highlights 2-bar immediate reversals, 3-bar standard reversals, and continuation structures specifically when they form inside the Premium/Discount extremes.
Alert System
The script includes a ready-to-use alert system focused on the highest probability setups:
Turtle Soup Buy: Triggers when a bullish liquidity sweep is detected, dropping below the HTF low and rejecting back inside during the optimal time window.
Turtle Soup Sell: Triggers when a bearish liquidity sweep is detected, pushing above the HTF high and rejecting.
Note: To set these up, create an alert on TradingView, select this indicator, and choose "Any alert() function call".
How to Use:
Let the skeleton form during the early parts of the session (Asia/London).
Wait for the time to cross the 0.5 midline of the box.
Look for the price to sweep the outer boundaries of the skeleton (Turtle Soup trigger).
Enter on the rejection, targeting the 0 (Balance) line or the opposing Premium/Discount extreme, using FVGs and VWAP as dynamic targets. Indicatore
Liquidity Sweep Retracements [MarkitTick]💡An advanced analytical framework designed to decode market micro-structure by evaluating the depth, speed, and statistical probability of price pullbacks. Rather than relying solely on static Fibonacci levels, this tool dynamically tracks the historical characteristics of an asset's swing behavior, alerting the user to structural anomalies and shifts in momentum. By intersecting retracement analysis with liquidity sweep detection and a built-in heatmap, this framework offers a comprehensive lens into market behavior, isolating environments where trend continuation is highly probable versus areas prone to exhaustion.
✨ Originality and Utility
Standard market analysis often relies on rigid tools that do not adapt to changing volatility conditions. This script introduces a highly original dynamic evaluation method by actively saving the characteristics of recent price swings into an internal array and establishing a moving statistical baseline.
The primary utility of this script lies in its multidimensional analysis. It does not just measure how far price has pulled back; it calculates how fast the pullback occurred and compares this velocity to the asset's recent historical baseline. This enables the framework to categorize price action not merely as a "pullback," but as a statistically significant "Anomaly" or an "Aggressive" move. Furthermore, by weaving Higher Timeframe (HTF) trend alignments and localized liquidity sweep detections into a single, cohesive dashboard and visual charting environment, it reduces chart clutter while exponentially increasing the depth of available data.
🔬 Methodology and Concepts
● Swing Structuring and Pivot Detection
The foundational logic relies on identifying structural pivot highs and lows through a localized lookback and look-forward window. The algorithm requires a definitive peak or trough isolated by user-defined left and right bars, establishing the anchor points for all subsequent mathematical measurements.
● Dynamic Retracement Scoring
Once a swing structure is confirmed, the script calculates the exact percentage of the retracement relative to the preceding impulse. These percentages are continuously categorized into defined behavioral zones:
Impulse (Less than 23%)
Shallow (Less than 38%)
Healthy (Up to 61.8%)
Deep (Up to 78.6%)
Reversal (Beyond 78.6%)
● Retracement Momentum Velocity (RMV)
Time and price are merged to extract velocity. By dividing the total percentage of the retracement by the number of bars it took to form, the script generates a velocity reading. This reading is dynamically compared against an array of historical velocities to determine if the current counter-trend move is unusually aggressive.
● Statistical Anomaly Detection
The script manages historical arrays of past retracement data, calculating a rolling mean (average) and standard deviation. An anomaly is triggered when a live retracement deviates significantly from this moving baseline, determined by a user-defined standard deviation multiplier. This mathematically highlights structural shifts before they mature into full trend reversals.
● Liquidity Sweep Verification
The indicator actively monitors price interactions with localized structural extremes. A bullish sweep occurs when price pierces a recent significant low but closes decisively above it, creating a structural trap. Bearish sweeps apply the inverse logic to structural highs.
🎨 Visual Guide
● Heatmap Candles
The script overrides standard candle colors with a dynamic heatmap that visually translates the health and speed of the current retracement:
Green indicates a healthy, standard retracement zone.
Orange highlights a weak zone, suggesting the trend is losing foundational strength.
Red warns of a deep structural violation bordering on a reversal.
Purple explicitly signifies an aggressive Retracement Momentum Velocity (RMV), warning of high counter-trend momentum.
● Price Action Overlays and Labels
Pivot Highs and Lows are marked precisely with small red and green crosses. (Note: These appear retroactively once the defined right-side bars confirm the pivot).
Data Labels are plotted at swing extremes. These carry a dark blue-gray background with dynamic text colors. They display the exact retracement percentage alongside quality badges, anomaly alerts (orange for opportunity, red for danger), and RMV warnings.
● Liquidity Markers
When a sweep is detected, small distinct shapes appear. "LS" text markers are plotted in bright green below bullish sweeps and bright red above bearish sweeps, visually anchoring liquidity traps directly onto the price action.
● The Analytical Dashboard
Located in the top right corner, this panel serves as the central intelligence hub. It utilizes shaded backgrounds to organize critical data natively on the chart.
Retracement and Health bars utilize block characters (█/░) to visualize strength out of 100%.
HTF Alignment displays the macro bias via clear text and color codes (Green for Bullish, Red for Bearish).
The dashboard aggregates averages, velocities, and quality metrics into a readable, high-contrast matrix.
📌 Note : the best way to resolve visual overlap is to navigate to the Object Tree and drag the indicator above the main chart layer, or simply hide the native candles in your chart settings.
📖 How to Use
Traders should monitor the dynamic relationship between the visual candle heatmap and the dashboard metrics.
Trend Continuation: Look for retracements that remain within the "Healthy" or "Shallow" zones (highlighted by green candles and positive dashboard health scores) that align with a bullish HTF signal.
Anomaly Exploitation: If an anomaly label appears marking a shallow retracement (orange text warning), this historically suggests an unusually strong impulse where standard deep pullbacks may not materialize.
Exhaustion Warnings: If the candles shift to purple, indicating an RMV Aggressive state, the counter-trend velocity is statistically high. Traders may use this to delay entries until momentum normalizes, or to identify structural traps if this aggression ends in a marked Liquidity Sweep (LS marker).
⚙️ Inputs and Settings
• Swing Settings
Controls the sensitivity of pivot detection. Higher values filter out market noise for major swing structures, while lower values react quickly to micro-trends.
• Retracement and Anomaly Parameters
Dictates the maximum number of historical retracements held in the memory array. The Standard Deviation Threshold allows users to expand or contract the mathematical boundary for what qualifies as an anomaly.
• RMV (Velocity) Limits
Controls the aggression threshold. Adjusting the multiplier determines how much faster a retracement must be compared to the historical average to trigger the purple heatmap and aggressive warnings.
• Liquidity Sweeps
Defines the lookback length for identifying local highs and lows that act as liquidity pools.
• Alerts and Dashboard Configuration
Enables fully customizable JSON-formatted alerts based on statistical deviations, and allows users to toggle or completely restyle the visual dashboard and heatmap components.
🔍 Deconstruction of the Underlying Scientific and Academic Framework
This indicator is heavily anchored in statistical mechanics and kinematics principles applied to financial time-series data.
• Gaussian Distribution and Variance
Instead of utilizing fixed geometric sequences (such as the Golden Ratio), the framework treats market swings as a dataset exhibiting normal distribution characteristics. By calculating the variance and extracting the standard deviation of historical swing depths, the script establishes mathematically sound confidence intervals. When price action breaches these standard deviation bands, it represents a statistically significant outlier, formally alerting the user to a fat-tail market event.
• Financial Kinematics
The integration of Retracement Momentum Velocity (RMV) introduces physics-based kinematic principles to price action. In traditional mechanics, velocity is the rate of change of position with respect to a frame of reference. The algorithm defines the frame of reference as the structural swing, calculating velocity as the percentage of displacement per unit of time (bars). By tracking the rolling average of this velocity, the script can algorithmically determine when kinetic energy in a counter-trend direction is statistically abnormal, independent of the actual price level reached.
⚠️ Disclaimer
All provided scripts and indicators are strictly for educational exploration and must not be interpreted as financial advice or a recommendation to execute trades. We expressly disclaim all liability for any financial losses or damages that may result, directly or indirectly, from the reliance on or application of these tools. Market participation carries inherent risk where past performance never guarantees future returns, leaving all investment decisions and due diligence solely at your own discretion. Indicatore

Fibonacci A-B-C Volles Strategie-Board(ENGLISH)
---
The Fibonacci Betting-Playbook 062026: How to read the Strategy Board
If you want to succeed in the markets, you need more than just a gut feeling, you need a system that delivers crystal-clear odds. This script is your personal bookmaker dashboard directly on the chart. It scans price movements for a highly profitable pattern and shows you exactly when the risk-reward ratio is as good as a massively overpriced underdog quote in La Liga.
Here is the official manual for you and your users, so that everyone knows exactly how to read the signals and when it's better to keep your feet still.
The Game Plan: The A-B-C Formation
In the background, the script constantly scans for a specific market movement, the so-called A-B-C ZigZag. Think of it like the perfect set piece:
Point A (The Kickoff): The lowest point where the movement begins.
Point B (The First Goal): The first high point. The momentum is here.
Point C (The Tactical Pause): The price drops back slightly. Exactly here, in this pullback, we calculate our entry before the second half – the next big price breakout – begins.
As soon as the script recognizes this formation, it paints your playing field (the boxes) onto the chart.
Your Betting Odds: The Zones on the Board
When the setup is "hot", you will see two distinct boxes on your screen. They take the guesswork out of the equation and tell you exactly where you need to place your chips.
🟢 The Green Zone: The Entry (The Value Bets)
Here is where you build your position. If the price falls into this box, we have a statistical advantage (edge).
Line 0.500 (Initial Entry): The market has corrected half of its rally. Here you place your first, smaller bet.
Line 0.618 (Ideal Reload): This is the "Golden Ratio". The absolute sweet spot in the Fibonacci system. If the price drops here, you double down. The chance of a bounce is highest here.
Line 0.667 (The Last Bastion / STOP): The red dashed line. If the price falls below this, the setup is busted. The trade is canceled, you pull the ripcord, and accept the small loss. No hoping, no praying – strict bankroll management.
🟠 The Orange Zone: The Cashout (Taking Profits)
If the trade plays out and the price shoots up, this box shows you where the bookie opens the register.
Line 1.618 (Potential Turning Point): Your first target (Take Profit 1). Here you take a portion of your winnings off the table. Ring the register!
Line 1.809 (Trailing Stop-Loss): The price keeps running? Perfect. Trail your stop-loss to your entry price now. You are now riding a risk-free bet.
Line 2.000 (Massive Resistance): The absolute maximum. The air gets extremely thin up here. Take your remaining profit and close the position.
🔴 The VAR Signal: The Red Warning Box
Markets are often chaotic. If the script fails to recognize a clear A-B-C pattern, the stop-loss has been hit, or the target has already been reached, the system immediately deletes all lines from the chart.
Instead, a red box appears in the center: "CURRENTLY NO RECOMMENDATION POSSIBLE - WAIT FOR FURTHER CHART SIGNALS".
This is like a suspended betting market during a VAR check. Your only task at this moment: Do not trade. Keep your hands off the buy button. Wait patiently until the system builds the next profitable setup.
What you as a user must absolutely pay attention to (The Golden Rules)
Patience is your best croupier: Do not trade blindly just because the price is moving. Always wait until the boxes appear on the chart and the price dips into the green zone.
Respect the Stop-Loss (0.667): Even in the best Spanish casinos, you don't win every hand. If the red line is breached, close the trade on Trade Republic immediately. Whoever hesitates here gambles away their bankroll.
Split your stakes: Do not wager your entire capital at the 0.500 line. Make a partial entry and keep your powder dry in case the price drops to the golden 0.618 line. This massively improves your average entry price.
Secure your profits: When the price reaches the orange 1.618 line, do not get greedy. Take a partial profit. Nothing is more frustrating than turning a fat paper profit back into a loss.
Indicatore

Indicatore

Smart Money ScalpSmart Money Scalp (CHoCH + Dynamic Fibonacci)
Technical Summary:
Smart Money Scalp is a high-fidelity market structure engine engineered for traders who demand precision in both high-frequency scalping and structural swing trading. The indicator utilizes advanced fractal pivot logic to identify Character Change (CHoCH) events—the earliest signal of a trend reversal—and automatically projects institutional Fibonacci retracement zones.
Timeframe Versatility:
While specifically optimized for ultra-fast execution on Lower Timeframes (1m, 5m, 15m), the script's core structural algorithms are equally robust for Higher Timeframes (1H, 4H). This makes it a versatile powerhouse for both aggressive intra-day scalpers and disciplined structural swing traders who seek to capitalize on institutional order flow.
Key Features:
Automated Structural Analysis: Real-time identification of Market Structure Shifts (MSS/CHoCH) based on customizable fractal lengths.
Institutional Golden Zones: Automatically highlights the 0.382 - 0.618 (Optimal Entry Zone) and the 1.382 - 1.618 (Expansion/TP Zone) using dynamic, bar-synced projections.
Dynamic Visual Scaling: Fibonacci levels and boxes expand in real-time with price action, providing a live roadmap of market dynamics.
Smart Noise Reduction: Historical text labels are automatically purged upon new setup generation to maintain a professional, clutter-free charting environment.
Confluence Filters: Optional Volume Weighted Confirmation and a Multi-algorithm Trend Filter (SMA, EMA, VWMA, etc.) are integrated to filter out low-probability liquidity traps.
Pro Alert Integration: Dedicated alerts for "CHoCH Formation" and "Entry Zone Infiltration," allowing for hands-off monitoring.
Trading Protocol:
Detection: Monitor for a CHoCH break confirming a shift in market character.
Confluence: (Optional) Ensure the break is supported by the Hacim (Volume) and Trend filters.
Execution: Identify entry triggers within the blue "ENTRY ZONE".
Distribution: Target the green "TP ZONE" for profit taking during price expansion.
Disclaimer:
Trading financial instruments involves high risk. This tool is intended for analytical and educational purposes. Always prioritize capital preservation and utilize strict risk management protocols. LuxAlgo does not guarantee financial results. Indicatore

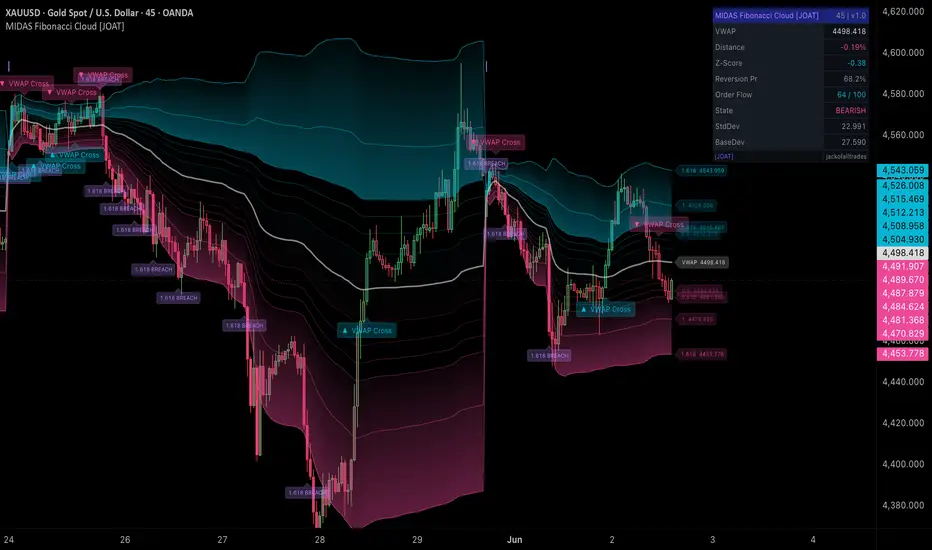
MIDAS Fibonacci Cloud [JOAT]MIDAS Fibonacci Cloud
Introduction
MIDAS Fibonacci Cloud is an open-source VWAP-based analytical tool that combines a MIDAS-anchored volume-weighted average price with six Fibonacci-scaled standard deviation bands, a Z-score probability engine, and a synthetic order flow score to produce an integrated picture of institutional value, statistical deviation, and directional pressure on a single overlay.
The problem this solves is band relevance. Standard VWAP deviations use fixed multipliers (1×, 2×, 3× standard deviation) that carry no structural meaning in market terms. Replacing those multipliers with Fibonacci ratios (0.236, 0.382, 0.5, 0.618, 1.0, 1.618) means the band levels correspond to proportional retracement relationships that institutional participants commonly reference. The 1.618 band in particular acts as an extreme extension zone where reversion probability, quantified by the built-in Z-score engine, typically exceeds 99.7%.
Core Concepts
1. MIDAS VWAP with Configurable Anchoring
The VWAP calculation uses the MIDAS method — cumulative volume-weighted price that resets at a user-selected anchor point rather than running as a continuous session VWAP. The anchor can be set automatically (based on the current timeframe), manually to a specific higher timeframe, or to a precise date. This allows the VWAP to be anchored to any significant market event.
The variance term used for standard deviation is computed directly from the volume-weighted sum of squared prices, producing a statistically correct VWAP standard deviation:
float midasVwap = sumVolPrice / sumVol
float variance = (sumVolSq / sumVol) - math.pow(midasVwap, 2)
float stdDev = math.sqrt(math.max(0, variance))
2. Fibonacci Deviation Bands
Six band pairs are computed above and below the VWAP anchor using the standard deviation scaled by a global sensitivity multiplier and each Fibonacci ratio. Upper bands are colored in the bull theme color with decreasing opacity from band 1 to band 6; lower bands in the bear theme color with the same gradient. A gradient fill connects the outer zone (fib4–fib6) to visually highlight the extreme deviation region.
3. Z-Score and Bell Curve Probability
Each bar's Z-score is computed as the signed distance from the VWAP in units of standard deviation. The dashboard converts this to a mean-reversion probability using standard normal distribution thresholds: within 1σ = 68.2%, within 2σ = 95.4%, within 3σ = 99.7%, beyond 3σ = 99.9%.
4. Synthetic Order Flow Score
A bar-level order flow score is computed from three components: candle body-to-range ratio (directional conviction), volume relative to the 20-bar average (institutional participation), and wick rejection percentage (price acceptance or rejection). These are weighted 40/35/25 and scored 0 to 100. VWAP crossover signals are gated by this score — crossovers with low order flow scores are filtered as noise.
5. Gradient Fill Zones
The two outer Fibonacci bands (fib4 and fib6) are connected with a gradient fill that creates a visual glow effect identifying the extreme deviation zones — the regions where price is statistically most likely to be overextended.
Features
MIDAS VWAP with three anchor modes: Auto (timeframe-adaptive), Timeframe (manual higher TF), Date (specific date anchor)
Six Fibonacci deviation band pairs: Levels at 0.236, 0.382, 0.500, 0.618, 1.000, 1.618 × standard deviation × global sensitivity
Gradient fill on extreme zones: Color-to-transparent gradient between fib4 and fib6 identifies overextension zones
Z-score and reversion probability: Computed every bar with bell curve probability output (68.2% / 95.4% / 99.7% / 99.9%)
Synthetic order flow gate: Body ratio, volume participation, and wick rejection combined into a 0-100 score that gates VWAP cross signals
Candle coloring by Z-score: Bar colors intensity-coded by distance from VWAP — neutral near center, saturated at extremes
Band labels at right edge: Each band level labeled with its Fibonacci ratio and price value, updated each bar
Anchor reset marker: Vertical marker in elite theme color at each VWAP reset point
Four color themes: Phantom, Neon, Classic, Solar
Non-repainting: VWAP and bands computed cumulatively from anchor; no future data referenced
Institutional dashboard: 8-row table showing VWAP price, distance %, Z-score, reversion probability, order flow score, and market state
Input Parameters
Anchor Settings:
Anchor Method: Auto / Timeframe / Date
Manual Timeframe: Timeframe to anchor to when method is Timeframe
Manual Date: Specific timestamp when method is Date
Fibonacci Multipliers:
Global Sensitivity: Scales all band widths proportionally (default: 1.2)
Fib Level 1 through 6: Individual Fibonacci ratios (defaults: 0.236, 0.382, 0.500, 0.618, 1.000, 1.618)
Visual Styles:
Color Theme: Phantom / Neon / Classic / Solar
Highlight Candles: Toggle candle coloring by Z-score
Show Band Labels: Toggle right-edge price labels on each band
Table Position and Size
How to Use This Indicator
Step 1: Choose Your Anchor
For intraday scalping, use Auto or Daily anchor. For swing trading, use Weekly or Monthly. For event-driven analysis, use Date and anchor to a specific earnings release, FOMC announcement, or major swing point.
Step 2: Read Band Levels as Statistical Reference
The 0.5 band is one half standard deviation from VWAP — a mild deviation typical of normal trending behavior. The 1.618 band is the extreme extension zone. Price at the 1.618 band has a statistical reversion probability above 99.7%, but this does not mean reversion is imminent or guaranteed.
Step 3: Check the Reversion Probability
Read the Reversion Prob row in the dashboard. As Z-score rises above 2, reversion probability exceeds 95.4%. This quantifies how unusual the current deviation is relative to the full history from the anchor point.
Step 4: Confirm with Order Flow Score
The Order Flow score reflects whether the current bar has institutional characteristics. A high score (above 60) during a VWAP cross suggests genuine participation. A low score (below 30) during a cross suggests a potentially false signal.
Indicator Limitations
The VWAP standard deviation widens significantly with the anchor period. Bands anchored to a six-month period will be very wide; bands anchored to one day will be tight. The global sensitivity parameter must be adjusted accordingly
The Z-score probabilities assume normally distributed returns, which markets do not produce. Fat tails mean extreme Z-scores occur more frequently than the percentages suggest
The synthetic order flow score uses tick volume as a proxy for actual order flow. On assets with low tick frequency, this approximation is less reliable
VWAP-based analysis is most relevant for liquid instruments
This indicator does not generate entry or exit signals. It provides statistical deviation context
Originality Statement
Replacing standard deviation band multipliers with Fibonacci ratios (0.236 through 1.618), scaled by a volume-weighted standard deviation from a MIDAS anchor, is not replicated in existing open-source Pine Script v6 VWAP publications
The combination of Z-score computation, bell curve probability quantification, and a synthetic order flow score as a gate for VWAP cross signals within a single indicator is an original integration
The candle coloring gradient driven by Z-score intensity provides real-time deviation awareness directly on price bars without requiring a separate oscillator panel
Disclaimer
This indicator is provided for educational and informational purposes only. It is not financial advice. Trading involves substantial risk of loss. Statistical deviation probabilities are based on a normal distribution assumption that financial markets do not satisfy. Past VWAP behavior does not predict future price action. The author accepts no responsibility for trading losses resulting from use of this indicator.
Made with passion by jackofalltrades
Indicatore

SXA: Super Xtation Amplitude | MTF FrameworkSXA (Super Xtation Amplitude) is a multi-timeframe market positioning framework designed to provide a complete visual overview of price location within the broader market structure.
Rather than focusing on entry signals, SXA combines trend context, volatility, session activity, anchored VWAPs, prior-day reference levels, Fibonacci projections, and higher-timeframe moving averages into a single environment. The objective is to help traders understand where price is currently trading relative to statistically and structurally significant areas.
The indicator was built around a simple principle:
"Price behaves differently depending on where it is located within the market."
By integrating multiple forms of context into one view, SXA allows traders to quickly identify premium and discount zones, trend alignment, session-driven liquidity areas, and potential reaction levels without switching between multiple indicators.
FEATURES
• Smart Trend Engine
Multi-timeframe moving average framework designed to visualize short, intermediate, and macro directional bias.
• Dynamic Trend Clouds
Visual cloud structures help identify trend alignment and potential transition zones between bullish and bearish conditions.
• Higher Timeframe Context
Daily 50 SMA and 200 SMA provide broader market structure and long-term directional references.
• Prior Day Reference Levels
Automatic plotting of previous day's Open, High, Low, and Close.
• Fibonacci Expansion Grid
Extended Fibonacci projections derived from the previous day's range to identify potential reaction zones and liquidity targets.
• Anchored Session VWAPs
Includes:
* Daily VWAP
* European Session VWAP
* Pre-New York VWAP
* New York Session VWAP
* Post-European Session VWAP
These levels provide institutional-style references for price acceptance and value.
• Weekly Structure Levels
Dynamic weekly Open, High, and Low levels update in real time throughout the trading week.
• Session Mapping
Visual session boxes highlight important market periods, including the Asian session and Pre-New York range.
INTENDED USE
SXA is designed as a contextual decision-support tool rather than a standalone trading system.
The indicator can be used to:
* Assess overall market positioning.
* Identify trend alignment across multiple timeframes.
* Locate potential support and resistance zones.
* Track session-driven liquidity.
* Monitor volatility expansion and contraction.
* Build discretionary trade narratives.
* Enhance existing trading systems.
SXA does not generate buy or sell recommendations. Instead, it seeks to answer a more fundamental question:
"Where is price currently located within the broader market landscape?"
By providing that context at a glance, traders can make more informed decisions while reducing chart clutter and indicator overload.
Created by @Peter_n_n
Indicatore

Confirmed Fibonacci with Market StructureConfirmed Fibonacci with Market Structure
-Description
A Fibonacci retracement tool for trend-continuation setups. It draws only after price has confirmed a directional move through market structure, then locks the levels in place so the pullback zone stays where it was set.
-What it does
The script applies three conditions before it draws a retracement, and once it draws, the anchors are fixed until the setup is invalidated:
- it requires a break of structure, not just any swing;
- it requires the impulse to be large enough relative to recent volatility;
- it can require agreement from the higher timeframe.
The result is a small number of retracements, drawn on moves that have shifted structure, that stay in place once set.
-How the detection works
1. Swing pivots. The script identifies swing highs and lows using pivot detection — a bar is a pivot high when it is the highest over a set number of bars to its left and right (the Pivot length input), and the reverse for a pivot low. These pivots define the prior swing and the structural reference levels.
2. Break of structure. For a bullish leg, the script takes the most recent prior swing low as the origin, then looks for an impulse high that trades above the last swing high formed before that low. Trading above that prior high is the break of structure — confirmation that buyers have shifted structure upward. The bearish case is the mirror image (a swing high origin, and an impulse low that breaks the prior swing low).
3. Displacement filter. The impulse is only accepted if its size (impulse high minus origin low) is at least a chosen multiple of ATR(14) — the Min displacement (ATR) input. Normalising to ATR judges a move on a quiet instrument and a volatile one on the same scale, and filters out small, insignificant structural breaks.
4. Draw timing. In Fast Draw mode the leg confirms on an asymmetric impulse pivot (fewer bars required to the right of the extreme), so the fib appears sooner after the high or low. With Fast Draw off, it instead waits for a completed pullback pivot before drawing — slower, but it only commits once a retracement is already underway.
-The Fibonacci leg and golden zone
When a bullish leg confirms, 0.0 is placed at the impulse high and 1.0 at the origin low, so the retracement levels measure how far price pulls back into the move (bearish legs are inverted). The shaded 0.618–0.786 band is the golden zone — the area where trend-continuation pullbacks commonly find support or resistance. A dashed line marks the broken structure level (BOS), and the impulse leg is labelled at its anchors (HH/HL for a bull leg, LH/LL for a bear leg).
-Higher-timeframe bias
The optional bias filter reads swing structure from the next standard timeframe up (for example, a 1-hour chart reads the 4-hour). That timeframe is rated bullish when its recent structure prints higher highs and higher lows, and bearish on lower highs and lower lows. With the filter on, the script only draws bullish legs in a bullish higher-timeframe context and bearish legs in a bearish one, and it clears the active leg if the higher timeframe flips against it. The request uses confirmed values with no lookahead.
-Invalidation and refresh
A bullish leg is invalidated when price closes below its origin low, with a small ATR buffer to absorb wicks; bearish legs mirror this. A leg is also cleared if it goes stale — when no new structure forms within a configurable number of bars. Until one of those happens, the anchors stay locked, so the levels on your chart are the same ones set when the leg confirmed.
-How to use it
This tool is built for trending markets and continuation trading, not ranges. The premise is simple: after a structure break and a displaced impulse, a trend often pauses and retraces before continuing in the same direction, and the golden zone is where that retracement commonly runs out of steam.
- Trade with the leg, into the pullback. On a confirmed bullish leg, treat the 0.618–0.786 golden zone as a pullback entry zone for longs — you are looking to join the move as price retraces into it, not to fade it. On a bearish leg, the same zone is where you look for shorts as price pulls back up into it.
- Use the higher-timeframe filter for alignment. Leaving HTF Bias on keeps you taking pullbacks in the direction of the larger trend, which is the context where continuation setups tend to hold up best. Turning it off shows every confirmed leg regardless of the bigger picture.
- Anchor risk to the structure the tool already marks. The origin (the 1.0 level, where the leg began) is the natural invalidation — a close back through it means the continuation idea has failed, which is also when the script clears the leg. Targets are typically toward the impulse extreme or beyond it. The BOS line shows the level whose break confirmed the move.
- Read the zone, don't blindly buy or sell it. The golden zone is an area of interest, not a trigger. Wait for your own confirmation inside it — a reaction candle, a lower-timeframe shift in structure, or whatever you normally use — before committing.
- The golden zone isn't the only level worth watching. Shallower retracements such as the 0.382 or the 0.500 often hold in strong trends that don't pull back far, while the deeper 0.618–0.786 zone tends to come into play on bigger retracements. Different instruments and timeframes react at different levels, so test which ones your pairs respect and toggle the levels you don't use off to keep the chart clean.
- Filter the chop. In ranging or low-momentum conditions a structure break is more likely to fail. Raise Min displacement (ATR) so the tool only draws on decisive moves, and set Pivot length to suit the timeframe (suggested starting points are in each input's tooltip).
-Inputs
-Structure
- Fast Draw (default on). On, the retracement is drawn as soon as the impulse, break of structure and displacement all confirm — the earliest possible draw. Off, it waits for a completed pullback pivot before drawing, which is slower but only commits once a retracement is already under way. Turning it off gives later but more conservative entries.
- Pivot length (default 8). Bars to the left and right used to confirm the structural swing highs and lows that define the prior swing and the break-of-structure reference. Higher values track larger, slower swings and draw fewer legs; lower values react to smaller swings and draw more. Rough starting points: 18 on 15m, 8 on 1h, 4 on 4h, 3 on daily.
- Impulse pivot R (default 3, Fast Draw only). The number of bars required to the right of the impulse extreme before it is accepted. Lower confirms the leg sooner after the high or low; higher waits for more confirmation, so the leg draws later but the extreme is more settled.
- Pullback pivot length (default 2, used only when Fast Draw is off). Bars left and right for the pullback pivot the script waits on before drawing. Lower draws faster on shallower pullbacks; higher requires a deeper, more developed pullback first.
- Min displacement (ATR) (default 1.5). The minimum impulse size, measured in ATR(14) units, before a structure break counts. Raising it ignores small moves and only draws on decisive ones; lowering it draws on smaller breaks too. As a guide: 0 accepts any impulse, 1.0 is modest, 1.5 is meaningful, 2.5 and up captures only major moves.
- Invalidation buffer (ATR) (default 0.25). A tolerance, in ATR(14) units, added beyond the origin before the leg is invalidated, so a single wick through the level doesn't cancel the setup. Higher gives the trade more room before it's cleared; lower invalidates more strictly.
- Max leg age (bars) (default 150). If no new structure forms within this many bars, the leg is treated as stale and cleared. Lower keeps only fresh setups on the chart; higher lets a quiet leg persist longer.
- Pivots retained (default 15). How many recent pivots the script keeps in memory to look back through when building a sequence. Higher allows it to reference older swings; lower keeps it focused on the most recent structure. Mostly affects edge cases — the default suits most charts.
HTF Bias
- Use HTF bias filter (default on). When on, the script only draws legs that agree with the higher-timeframe trend and clears a leg if that timeframe flips against it. Turning it off shows every confirmed leg regardless of the larger trend.
- HTF pivot length (default 3). Bars left and right used to read swing structure on the higher timeframe. Higher reads a broader, slower higher-timeframe trend; lower makes the bias more responsive.
Fib Levels
- 0.000 to 1.000 toggles. Switch each standard retracement level on or off independently, so you can show only the ones you trade.
- Custom level (default off, 0.75). Enables one extra level at a ratio you choose, with its own colour — useful for a level such as 0.705 or 0.79 that sits outside the standard set. Drawn alongside the standard levels.
Visual
- Colour Theme (default "Default"). Sets the dashboard colours and the fib line colour. Ten themes are included; purely cosmetic.
- 0.500 line color, Golden zone fill, Golden zone edge, Impulse line color, BOS line/label color. Individual colour controls for those specific elements, so you can tune contrast against your chart.
- Show BOS line + label (default on). Draws the dashed line at the broken structure level with a "BOS" tag. Off hides it for a cleaner chart.
- Show impulse line (default on). Draws the dashed line connecting the two anchors of the leg.
- Extend right (default on). Extends the level lines to the right of the current bar so they project forward; off ends them at the current bar.
- Price labels (default on). Shows the price value beside each level.
- Anchor markers (default on). Labels the two anchor points (HH/HL or LH/LL) of the leg.
- Info panel (default on). Shows the dashboard with structure state, higher-timeframe bias, anchor prices and how long ago the impulse confirmed.
Alerts
- Alert on new fib drawn (default on). Fires when a new bullish or bearish leg is drawn.
- Alert on Golden Zone touch (default on). Fires the first time price touches the golden zone of the active leg.
**Notes**
Swing pivots confirm a fixed number of bars after the actual high or low, so a leg appears after that confirmation delay rather than at the exact extreme — this is inherent to pivot-based detection. Once drawn, anchors are locked and do not move. The higher-timeframe bias uses confirmed values without lookahead, so it does not repaint on historical bars, though like any higher-timeframe data it can update within a forming higher-timeframe bar in real time. These levels are decision support, not buy or sell signals.
**Disclaimer**
This indicator is for educational and informational purposes only and is not financial or investment advice. Past performance does not guarantee future results. Always do your own analysis and manage your own risk.
Indicatore
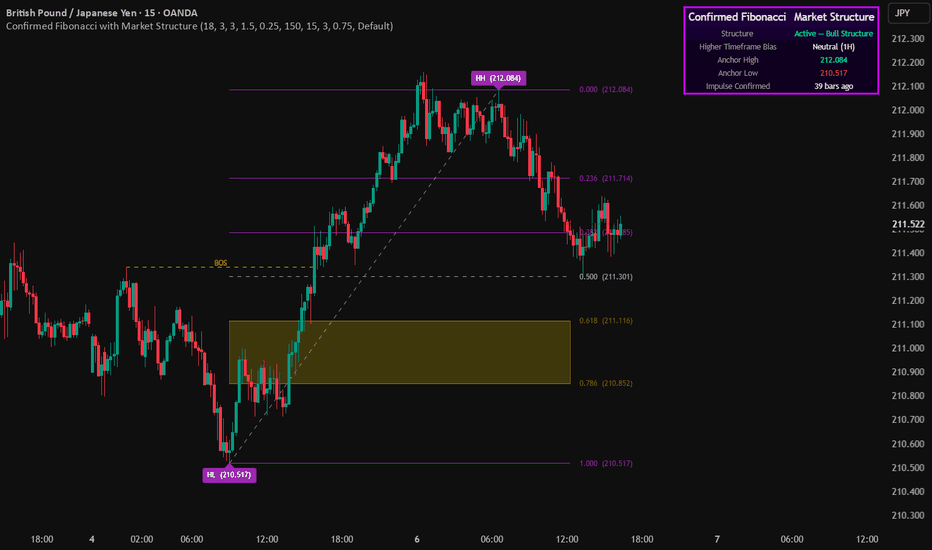
SmartBreak Fibo [TraderHook]SmartBreak Fibo
Stop drawing your setups by hand. SmartBreak watches market structure in real time, and the moment price breaks a structural swing — a BOS (Break of Structure) or CHoCH (Change of Character) — it instantly maps a full Fibonacci trade plan on your chart: entry, stop, and three targets. No manual fib dragging, no guesswork on where to place levels.
How it works
The engine tracks swing highs/lows and detects every structural break (BOS / CHoCH).
On each break, a Fibonacci is anchored from the broken swing (level 1) to the opposing swing (level 0).
Entry is plotted at the 0.618 retracement, Stop-Loss at level 0 (the swing extreme).
Three take-profits sit at fib extensions 2.0 / 2.618 / 3.618 .
A green box shows the profit zone (entry → TP3), a red box shows the risk zone (entry → SL).
Why traders like it
Setups appear the instant structure breaks — you decide whether to take them, the levels are already there.
Long breaks are marked green, short breaks red — direction is readable at a glance.
Fully adjustable: entry level, all three TPs, pivot sensitivity, colors, and how many recent setups stay on screen.
"ChoCh only" mode if you prefer to trade reversals over trend continuations.
Settings
Pivot Period — structure sensitivity (higher = bigger swings only).
Entry / TP1 / TP2 / TP3 — every fib level is yours to tune.
Number of recent setups — keep the chart clean with just the latest, or show history.
Long / Short setups — toggle either side on or off.
Credits
The market-structure engine (ZigZag, swing classification, BOS/CHoCH) is based on the open-source work of TFlab , used under the Mozilla Public License 2.0. The Fibonacci trade-box system is by TraderHook. Published open-source — feel free to study and build on it.
Disclaimer
This is a visualization tool, not financial advice or a signal service. The take-profit levels are mechanical Fibonacci extensions — they do not predict that price will reach any target. Always backtest and manage your own risk before trading. Indicatore

Dynamic Pivot Fibo Analytics [MarkitTick]💡 A highly advanced, automated technical analysis tool designed to objectively identify structural market swings and project key Fibonacci retracement and extension levels. By isolating mathematically confirmed pivot highs and lows, the algorithm eliminates the subjective bias traditionally associated with drawing retracement tools manually. The script dynamically maps out critical zones of interest—such as the widely observed Golden Pocket—while continuously evaluating the current price action against these historical vectors. Coupled with a real-time analytical dashboard, it provides traders with a comprehensive breakdown of swing volatility, level proximity, and directional bias, serving as a complete ecosystem for retracement-based methodologies.
✨ Originality and Utility
The primary utility of this script lies in its capacity to transform a traditionally manual and subjective charting process into an automated, mathematically rigorous system. While standard charting platforms require users to manually select anchor points for Fibonacci tools—often leading to inconsistent application—this script programmatically identifies the most statistically relevant extremums based on user-defined lookback periods.
Its originality is further highlighted by its multi-layered filtering architecture. Rather than treating every minor price fluctuation as a valid swing, the script incorporates an objective volatility filter utilizing either the Average True Range (ATR) or a strict percentage threshold. This ensures that only structurally significant market movements are measured, effectively filtering out stochastic market noise. Furthermore, the integration of an on-chart analytical dashboard and a dynamic level-touch highlighting system brings a level of interactive feedback rarely seen in standard visualization tools, allowing traders to instantly gauge the health and maturity of an active swing.
🔬 Methodology and Concepts
● Pivot Extrema Detection
The foundational logic relies on the identification of local minimums and maximums within a continuous time-series dataset. The algorithm evaluates a central candidate bar against a defined window of preceding and succeeding bars. A Pivot High is only confirmed if the candidate's high remains unbreached across the entire evaluation window, ensuring it represents a true structural peak. This mechanism inherently requires a confirmation delay to validate the peak, preventing the erratic shifting of anchors during live price formation.
● Swing Filtering and Validation
Once opposing pivot points are confirmed, the script calculates the absolute price range of the resulting swing. To prevent false positives in low-volatility environments, the script applies a normalization filter. It evaluates the raw swing range against either a fractional multiplier of the current ATR or a static percentage of the asset's price. Swings failing to meet this geometric threshold are automatically discarded, preserving chart clarity.
● Fibonacci Mathematics and Zonal Mapping
Upon validating a swing, the algorithm applies standard Fibonacci sequence ratios to the defined price vector. It calculates core retracements (0.236, 0.382, 0.500, 0.618, 0.786) and projects mathematical extensions (1.272, 1.618, 2.000) for target mapping. The script specifically isolates the 0.618 to 0.650 region, commonly referred to as the Golden Pocket, rendering it as a distinct filled zone to highlight its historical significance as an area of mean reversion.
🎨 Visual Guide
● Main Chart Elements
Swing Line: A distinct, solid line directly connecting the anchored Pivot Low and Pivot High, visually defining the active vector being measured.
0.000 and 1.000 Anchors: The baseline extremums of the swing, marked by precise labels and dashed/dotted lines to indicate the absolute boundaries of the measured range.
Key Retracement Levels (0.382 & 0.618): Rendered with emphasized, dashed lines to denote their elevated importance in traditional retracement theory. The 0.618 level utilizes a distinct gold color to draw the user's attention.
Minor Retracement Levels (0.236, 0.500, 0.786): Displayed using subtle, dotted lines to provide contextual support without overwhelming the primary visual hierarchy.
Golden Pocket Fill: A translucent shaded region spanning the area between the 0.618 and 0.650 price coordinates, serving as a primary zone of interest for exhaustion.
Touch Highlights: When the current price intersects any active Fibonacci line, the line's color dynamically shifts (defaulting to white), providing immediate visual feedback of level interaction.
Historical Swings: If enabled, the script retains ghosted, dotted representations of previously confirmed swings, allowing users to analyze past interactions without cluttering the active setup.
● Dashboard Elements
Direction: A color-coded textual readout confirming whether the active, validated swing is Bullish or Bearish.
Swing Range: A visual block-bar representation (scaling from 0 to 10) evaluating the magnitude of the current swing relative to the prevailing ATR.
Key Levels: Direct, high-precision price readouts for the critical 0.382 and 0.618 levels.
Levels Touched: A scoring metric visualizing how many individual Fibonacci levels the current price action has interacted with since the setup was confirmed.
0.618 Proximity: A dynamic strength bar indicating how close the current price is to the Golden Ratio, aiding in the anticipation of level tests.
Setup Age: A raw bar-count indicating the duration since the swing anchor was established.
📖 How to Use
Setup Identification: Apply the script to your chart and observe the automated generation of the Swing Line. The script will wait for the defined lookback period to confirm a pivot before drawing the corresponding Fibonacci grid.
Trend Context: Use the Dashboard to immediately confirm the direction and strength of the swing. A high Swing Range score indicates a robust structural move, lending higher confidence to the subsequent retracement levels.
Zone Monitoring: Focus attention on the highlighted Golden Pocket zone. As price retraces into this filled area, monitor for deceleration or reversal patterns. The built-in proximity score on the dashboard will alert you as price nears this critical threshold.
Interaction Feedback: Watch for the dynamic Touch Highlights. When a level changes color, it confirms that price has officially probed that mathematical coordinate.
Alert Automation: Instead of manually monitoring the chart, configure the script's alert parameters to notify you strictly when price touches a key level (such as the 0.382 or 0.618), streamlining your analytical workflow.
⚙️ Inputs and Settings
Swing Settings: Controls the structural strictness of the algorithm. Adjusting the "Left Bars" alters the required validation period for a pivot, while "Extend Lines" controls the horizontal projection length of the drawn levels.
Swing Filter: Toggles the volatility validation on or off. Users can select between an "ATR" multiplier or a pure "Percent" requirement, establishing the minimum acceptable size for a swing to be plotted.
Direction Filter: Allows the user to isolate the script's output to strictly Long setups, strictly Short setups, or Both simultaneously.
Fib Extensions & Golden Pocket: Provides granular control over the visibility and aesthetic rendering of the >1.000 extension levels and the specialized 0.618-0.650 fill zone.
Level Touch Alerts: Configuration options for automating notifications. Users can toggle alerts for specific key levels, all levels collectively, and customize the visual highlight color triggered by these interactions.
Historical Swings: Defines the quantity of past setups to retain on the chart for retrospective analysis.
Dashboard Settings: Customization parameters for the analytical table's background and text colors to ensure readability across different chart themes.
🔍 Deconstruction of the Underlying Scientific and Academic Framework
The theoretical foundation of this script intersects two distinct disciplines of market analysis: algorithmic extremum detection and geometric proportion analysis.
The extremum detection relies on a localized peak-trough evaluation algorithm. By isolating a data point and verifying that its scalar value is strictly greater than (or less than) all corresponding values within a symmetric `n`-period domain, the script establishes a mathematically unassailable structural node. This method effectively filters out continuous monotonic sequences and isolates true inflection points in the time-series data.
To prevent the algorithm from validating micro-fluctuations inherent in random walk market environments, it employs a normalization technique using Average True Range (ATR). ATR provides a dynamic measure of standard deviation over time. By forcing the absolute scalar difference between two validated extremums to exceed a fractional coefficient of the ATR, the script ensures that the analyzed vector falls outside the bounds of standard market noise, thereby validating its statistical significance.
Once the vector is established, the script applies the principles of the Fibonacci sequence—a recursive mathematical progression where the ratio of successive terms converges on Phi (approximately 1.618). In the context of market dynamics, these ratios (particularly their inverses and square roots, such as 0.618 and 0.382) have been empirically observed to act as psychological focal points for mass market behavior. The script translates these geometric proportions into static coordinate thresholds, creating a structured, grid-based framework for evaluating the amplitude and potential exhaustion points of counter-trend market phases.
⚠️ Disclaimer
All provided scripts and indicators are strictly for educational exploration and must not be interpreted as financial advice or a recommendation to execute trades. I expressly disclaim all liability for any financial losses or damages that may result, directly or indirectly, from the reliance on or application of these tools. Market participation carries inherent risk where past performance never guarantees future returns, leaving all investment decisions and due diligence solely at your own discretion. Indicatore
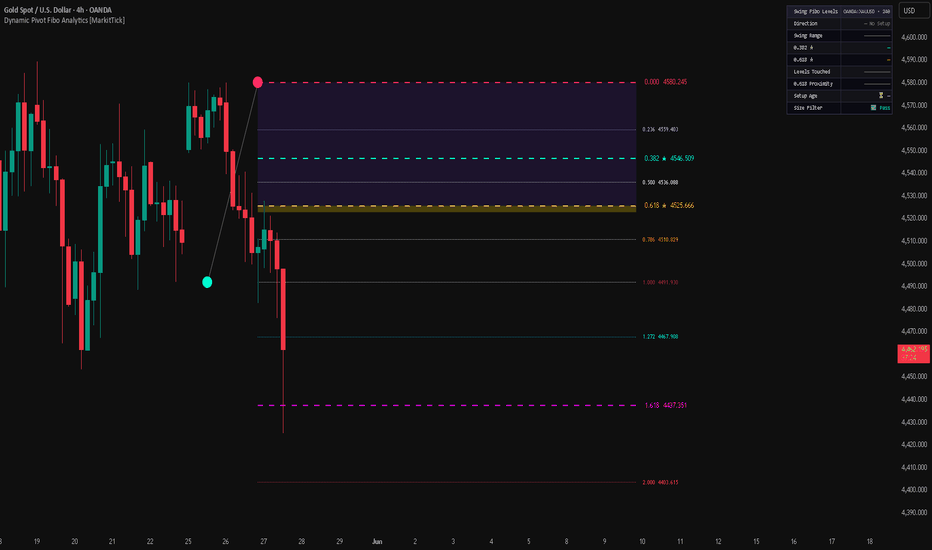
Hot zones Profile [Cartel Console]Overview
The Hot Zones Profile is a comprehensive market analysis tool designed to identify institutional interest areas through three primary lenses: Time-based Session Ranges, Volume Distribution (LVNs), and Delta-based Volume Profiles.
By combining session-specific volatility with historical volume gaps, this indicator highlights "Hot Zones" where price has historically moved quickly or is expected to find significant reaction levels.
Key Features
1. NY Session & Volatility Zones
The script tracks a specific user-defined time window (defaulting to the New York session transition). Once the session range is established, it projects a series of "Heatmap" levels based on standard deviations and range multipliers.
Bullish/Bearish Zones: Areas projected above and below the session range to identify potential overextension or reversal points.
Customization: Users can define the session time, timezone, and the extension length of these zones.
2. Heatmap Low Volume Nodes (LVN)
Market Profile theory suggests that Low Volume Nodes represent areas where price moved rapidly, often indicating a lack of auctioning or "unfair" prices.
Dynamic Detection: The script analyzes daily volume distribution to pinpoint these gaps.
Mitigation Logic: Zones can be set to "Fade" once price has re-tested and traded through them, helping traders identify which levels are still "fresh" and which have been mitigated.
Aesthetic Heatmaps: Uses glowing box visuals to represent the strength and location of these nodes.
3. Right-Side Delta Volume Profile
To provide a clear view of the current auction, the script plots a high-resolution Volume Profile on the right side of the chart.
Buy/Sell Delta: Unlike standard profiles, this highlights the "Stacked Delta," showing the ratio of buying vs. selling volume at every price level within the lookback period.
Volume Labels: Displays precise volume metrics (in Thousands) for high-activity nodes to assist in identifying Point of Control (POC) areas.
How to Use
Supply & Demand: Use the LVN zones as potential "magnets" or "rejection" zones where liquidity may be resting.
Session Bias: Use the NY Session boxes to define the intraday range and look for "Hot Zone" extensions for potential trend exhaustion.
Volume Confirmation: Observe the Right-Side Profile to see if price is currently trading in high-volume areas (balance) or low-volume areas (imbalance).
Settings
Session Time: Set your preferred anchor time (defaults to NY).
LVN Strength: Adjust how "quiet" a price level must be to qualify as a Low Volume Node.
VP Offset: Move the profile further right to clear space for price action.
Disclaimer:
This indicator is a tool for technical analysis and does not constitute financial advice. Always use proper risk management. Indicatore

SMC Liquidity Sweep & Fibonacci Extension [MarkitTick]💡 A highly advanced, multi-faceted chart overlay engineered to synchronize market structure analysis, dynamic liquidity tracking, and harmonic Fibonacci projections. By continuously parsing raw price action through a confluence-based scoring system, this indicator provides technical analysts with a unified framework for identifying localized structural shifts, mapping premium and discount pricing zones, and projecting precise forward targets using automated ABC ZigZag structures. It functions as a complete technical environment designed to remove the need for multiple disparate chart overlays.
✨ Originality and Utility
Standard indicators often focus on a single mathematical concept, leaving the analyst to manually stitch together multiple tools to form a cohesive thesis.
This script completely breaks that mold by merging a rigorous market structure shift (MSS) engine with an adaptive, volatility-adjusted Fibonacci structure mapper.
It introduces a highly original dynamic confluence scoring system that grades current setups in real-time based on higher timeframe (HTF) alignment, session timing, and liquidity events.
The inclusion of ATR-adaptive stop losses, order block mitigation tracking, and full webhook alert integration makes it an exceptionally utilitarian system for both discretionary chart analysis and automated alert routing.
Rather than cluttering the screen with infinite historical data, the indicator utilizes a smart-pruning engine that actively hides or greys out mitigated order blocks, filled gaps, and invalidated Fibonacci setups.
🔬 Methodology and Concepts
● Market Structure & Liquidity Engine
The script utilizes a localized loop lookback to identify significant pivot highs and lows, forming the absolute mathematical foundation of its trend analysis.
A liquidity sweep is mathematically confirmed when price pierces a previous structural pivot's extreme but fails to maintain momentum, thus confirming a reversal of localized volume.
Changes of Character (CHoCH) and Breaks of Structure (BOS) are dynamically generated and labeled when price confidently closes beyond confirmed pivot boundaries, establishing a directional bias.
● Fair Value Gaps (FVG) & Order Blocks
Fair Value Gaps are detected by comparing the extreme of the first candle to the extreme of the third candle in a three-bar sequence. If they do not overlap, a pure price imbalance zone is mathematically plotted.
Order Blocks are automatically mapped around the exact origin of a structural break, utilizing an Average True Range (ATR) offset to define the true boundary of the support or resistance zone.
The engine continuously tracks forward price interaction with these zones, automatically removing them from the visual field once mitigated by future price action to maintain chart clarity.
● Automated Fibonacci & ABC Structures
An internal ZigZag algorithm utilizes ATR to filter out baseline market noise, mapping only statistically significant price swings.
Once a valid three-point ABC structure is confirmed (where point C retraces but does not invalidate point A), the script automatically calculates forward projections.
Target extensions are generated using either linear geometric scaling or logarithmic interpolation, providing dynamic profit objectives that adapt to the underlying asset's volatility.
🎨 Visual Guide
● On-Chart Elements
Dashed Lines: Represent significant market structure breaks. Cyan dashed lines indicate a bullish structural shift, while magenta dashed lines indicate a bearish shift.
Text Labels: "CHoCH" or "BOS" text marks structural confirmations directly on the break line. Small yellow "IDM" labels highlight captured inducement levels within the trend.
Shaded Boxes: Cyan and magenta background boxes denote active Bullish and Bearish Fair Value Gaps. Mitigated order blocks turn deep grey if the user chooses not to hide them entirely.
Session Kill Zones: Golden transparent boxes highlight the London session volatility, bright green identifies the New York open, and deep orange maps the Asian range consolidation.
Fibonacci Projections: Dotted and solid lines extend dynamically to the right from valid ABC structures, detailing exact price targets and their associated harmonic or Elliott Wave ratios.
● Comprehensive Confluence Dashboard
Located firmly at the top right of the chart window, this panel continuously updates with the current state of the market environment.
It displays the active trend direction, an aggregate Confluence Score out of 5 (color-coded from a neutral grey to a highly confident vibrant green), and the Higher Timeframe Bias.
Additionally, it provides immediate readouts on the current Premium/Discount pricing equilibrium, the active global trading session, liquidity sweep states, and real-time ATR values.
📖 How to Use
● Trade Qualification and Scoring
Monitor the Confluence Dashboard diligently. A score of 4 or 5 strongly indicates a high-probability alignment across multiple, independent market factors.
Wait for a confirmed liquidity sweep on the chart, followed immediately by a structural break (CHoCH or BOS) that aligns in the direction of the Higher Timeframe (HTF) trend bias.
● Entry Execution and Targeting
Utilize the automatically plotted Order Blocks and Premium/Discount zone quartiles to refine entry locations. Ideal long entries statistically occur within the discount quartile of the defined range.
Set realistic profit targets using the automated Fibonacci extensions. The 1.618 level (often labeled as Wave 3) serves as a primary extended objective for momentum-based moves.
Risk management should be tied directly to the ATR-adaptive stop-loss values calculated internally by the script, ensuring your stops are placed outside the immediate noise floor of the asset.
⚙️ Inputs and Settings
● Market Structure Configuration
Swing Length: Adjusts the raw sensitivity of pivot detection. Higher numeric values create a macro structural view; lower values capture micro intraday structures.
Risk/Reward Ratio: Modifies the theoretical profit targets generated specifically for the internal webhook alert payload system.
● Filters and Environmental Zones
HTF Timeframe: Allows the selection of the specific resolution for the background trend bias filter (e.g., 240 for a 4-hour bias on a 15-minute chart).
Premium / Discount Zone: Toggles the background display of mathematical range quartiles (Premium, Equilibrium, Discount).
Session Kill Zones: Activates time-based highlighting for major global trading hours, strictly aligned to UTC.
● Fibonacci Parameters
Use Logarithmic Scale: Switches all forward projection math to logarithmic scaling, an essential setting for high-volatility assets or deep historical charts.
Structure Invalidation: Deletes or greys out active ABC structures the moment current price completely breaks below the origin point (Point A).
● Webhook Action Routing
Open Long / Short Actions: Allows the user to define exact, customized JSON payload strings to route automated signals seamlessly to third-party execution platforms.
🔍 Deconstruction of the Underlying Scientific and Academic Framework
● Pivot Extrema and Range Equilibrium Theory
The identification of market structure inherently relies on local extrema calculation. A given point is mathematically considered a pivot high if its peak value is strictly greater than all adjacent values within a defined window.
By mapping these rolling extrema over continuous time series data, the script establishes an active topological trading range.
This range is subsequently divided into exact quartiles to define Premium and Discount pricing equilibriums, rooted in mean-reversion statistical theories.
● Volatility-Adjusted Noise Filtration
The internal ZigZag algorithm utilizes the Average True Range (ATR) to establish a dynamic, mathematically sound noise floor.
ATR evaluates the moving average of absolute price differentials over time, capturing true gap volatility.
A structural swing is only validated by the algorithm if the absolute price differential exceeds a defined, user-adjustable multiple of the ATR, ensuring mathematical robustness against ranging, low-volatility environments that cause false signals in standard pivot models.
● Harmonic Projection Mechanics
Forward Fibonacci extensions are calculated using either a standard linear geometric model or a complex logarithmic scale.
In linear application, a forward target for a given expansion ratio is derived directly from an ABC configuration by extrapolating the absolute distance of the primary impulse leg.
When logarithmic scaling is applied, the mathematical relationship transforms to exponentiate the natural log of the price coordinates.
This aligns the future projections with percentage-based compounding growth models, effectively addressing price scale distortions inherently found in exponential secular trends.
⚠️ Disclaimer
All provided scripts and indicators are strictly for educational exploration and must not be interpreted as financial advice or a recommendation to execute trades. I expressly disclaim all liability for any financial losses or damages that may result, directly or indirectly, from the reliance on or application of these tools. Market participation carries inherent risk where past performance never guarantees future returns, leaving all investment decisions and due diligence solely at your own discretion. Indicatore

ATR Fibonacci Trend Envelopes [BigBeluga]ATR Fibonacci Trend Envelopes is a professional-grade trend-following and mean-reversion framework. It combines the volatility-filtering power of Average True Range (ATR) with the mathematical precision of the Fibonacci Golden Ratio to define high-probability "buy/sell pockets" within an established trend.
Equipped with a live Multi-Timeframe (MTF) dashboard, this indicator allows traders to monitor trend alignment across four different time horizons simultaneously, ensuring that local entries are always supported by the broader market structure.
🔵 THE DUAL-ENGINE FRAMEWORK
Volatility-Adjusted Trend Engine: The indicator uses a customizable Moving Average (SMA, EMA, HMA, etc.) combined with an ATR multiplier to create dynamic envelopes. This filters out market noise and only signals a trend change when price decisively breaks the volatility boundary.
Dynamic Golden Pocket (0.618 - 0.786): Unlike static retracements, these Fibonacci levels are calculated relative to the current ATR envelope. The "Pocket" acts as a high-interest zone where price is expected to find support (in uptrends) or resistance (in downtrends).
Predictive Slope Projections: Using the current rate of change, the script projects the trend and Fibonacci levels into the future. This allows traders to visualize where "Value" will be in the coming bars, facilitating better trade planning and order placement.
🔵 CORE ARCHITECTURE
MTF Alignment Dashboard: A real-time table tracks the trend status and "Pocket" proximity across four timeframes. A "BULL" status combined with an "INSIDE" pocket signal across multiple timeframes indicates a high-confluence institutional setup.
Dynamic Transparency Feedback: The visual intensity of the Golden Pocket adapts based on price proximity. As price approaches the mid-point of the pocket, the colors become more saturated, providing an intuitive visual cue that the market is entering a high-probability reversal zone.
Momentum-Driven Basis: The trend baseline (1.0 level) acts as the ultimate anchor. As long as price remains above this volatility-adjusted line in a bullish regime, the trend is considered structurally sound.
🔵 FEATURES
Multi-MA Versatility: Choose from 5 different moving average types to calculate your trend basis, allowing the indicator to be tuned for slow-moving macro trends or fast-moving scalping setups.
Real-Time Level Labels: Clear, real-time labels (0.5, 0.618, 0.786, 1.0) on the right axis provide exact price targets and stop-loss anchors at a glance.
Customizable Projection Length: Adjust how far the indicator looks into the "future," allowing you to anticipate structural shifts before they occur on the chart.
Adaptive UI Positioning: The dashboard can be moved to any corner of the chart and scaled to match your screen resolution, ensuring it never interferes with your technical analysis.
🔵 STRATEGIC APPLICATION
The "Golden" Pullback: In a confirmed Bull trend (Cyan baseline), wait for price to enter the Dynamic Golden Pocket. Use the saturation of the baseFill color to identify the core of the value zone for a long entry.
MTF Confluence Trading: Only take trades when at least three timeframes on the dashboard show the same trend direction. If the 1H and 4H are "BULL" while the 15m enters the "INSIDE" pocket, you have a high-probability trend-continuation setup.
Volatility Breakouts: Monitor the distance between the baseline and the 0.5 Fib. When the ATR-based envelopes contract, a volatility breakout is imminent. A "⦿" label signal combined with a price cross of the 1.0 level marks the start of a new momentum cycle.
Dynamic Exit Planning: Use the projected 0.5 or 0.618 levels as trailing profit targets. Because these levels adjust for both price and volatility, they represent a mathematically "fair" area to take chips off the table.
ATR Fibonacci Trend Envelopes bridges the gap between classic technical analysis and modern volatility modeling. By combining MTF awareness with the natural pull of the Fibonacci ratios, it provides a clear, actionable map for navigating any market condition. Indicatore

Indicatore