Strategia

Indicatore

Indicatore

Indicatore

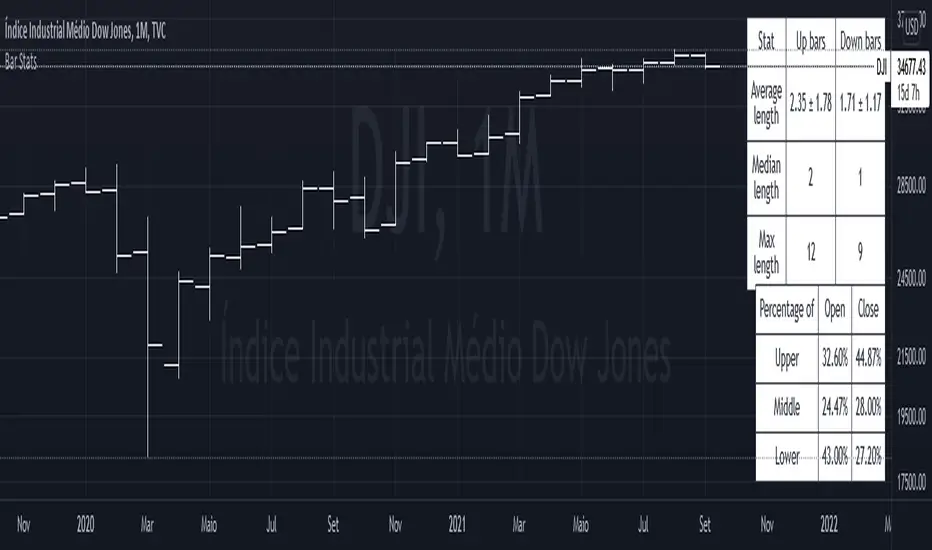
Bar StatisticsThis script calculates and displays some bar statistics.
For the bar length statistics, it takes every length of upper or lower movements and calculates their average (with SD), median, and max. That way, you can see whether there is a bias in the market or not.
Eg.: If for 10 bars, the market moved 2 up, then 1 down, then 3 up, then 2 down, and 2 up, the average up bars length would be at 2.33, while the average for the down length would be at 1.5, showing that upper movements last longer tha Indicatore

Indicatore

Indicatore

Indicatore

Indicatore

Indicatore

Indicatore

Indicatore

Indicatore
Indicatore

Indicatore

Indicatore

Indicatore

Indicatore

Indicatore

Strategia
Indicatore

Indicatore
Indicatore

Indicatore