Higher Timeframe Trend Frontier (Zeiierman)█ Overview
Higher Timeframe Trend Frontier (Zeiierman) is an adaptive higher-timeframe indicator designed to visualize HTF opening levels, developing price structure, directional movement, and potential trapped buyers and sellers.
Unlike traditional HTF indicators that simply plot historical highs, lows, and opening prices, Trend Frontier combines higher-timeframe structure with an adaptive price-tracking model and a two-sided market-pressure profile.
The indicator consists of four core
Medie mobili
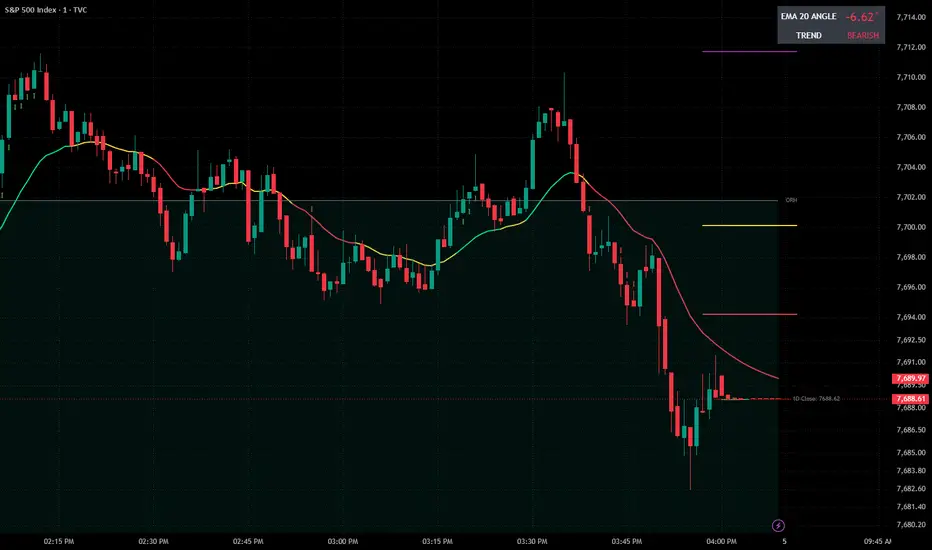
EMA 20 Angle MeterEMA 20 Angle Meter – Measure Trend Strength in Degrees
The EMA 20 Angle Meter is a technical analysis indicator designed to measure the slope and directional strength of the 20-period Exponential Moving Average (EMA).
Instead of simply showing whether the EMA is moving up or down, this indicator calculates its normalized slope and converts it into degrees, providing a numerical representation of trend direction and momentum.
Key Features
Real-Time Angle Measurement: Displays the current EMA 2
Indicatore
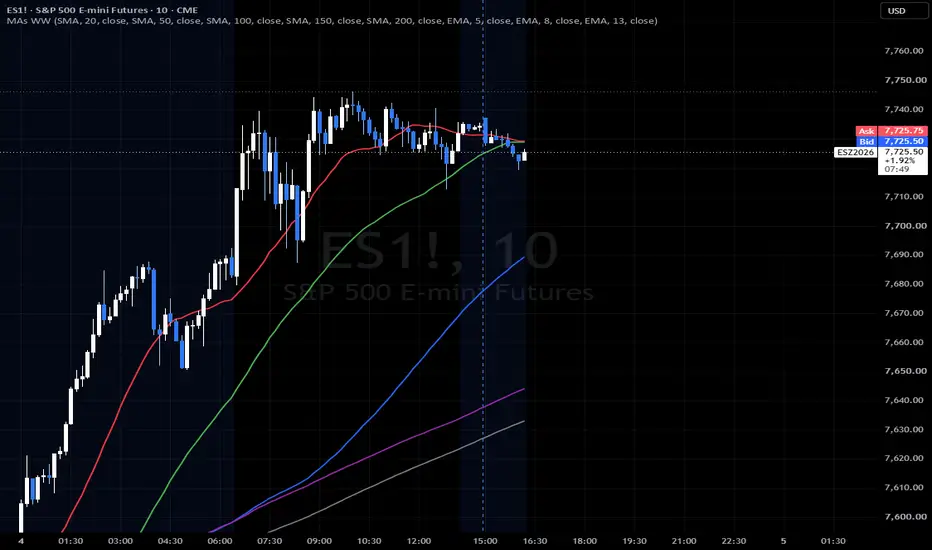
Custom Moving Averages group WWCustom Moving Averages group WW (MAs WW)
🌟 Overview
Say goodbye to chart clutter and rigid, single-purpose indicator scripts. Custom Moving Averages group WW is a sleek, highly versatile Pine Script v6 indicator engineered to give you ultimate control over your chart layout.
Whether you are swing trading macro indices and futures using classic SMAs or day trading equity options with fast-paced EMAs, this single script replaces multiple built-in indicators while keeping your workspace pristine.
Indicatore
Atty Trend Pro StrategyAtty Algo Trend Pro is a dual moving-average ribbon that now comes with a trade engine. The thing you read is still the band between the two lines: both share one colour, set by how far apart they are. Green is the fast MA above the slow by more than the neutral zone, red is below, yellow is inside it. The colour is a continuum, so a ribbon that has only just committed renders close to yellow and saturates as the gap widens.
WHAT IS NEW IN VERSION 2
It is a strategy. Signals, stops, targets an
Strategia
Efficiency Weighted Hull [BackQuant]Efficiency Weighted Hull
Overview
Efficiency Weighted Hull is a variation of the Hull Moving Average that adjusts the usual Hull lag-compensation term using Kaufman’s Efficiency Ratio.
A standard Hull construction uses:
Fast WMA = WMA(Source, Length / 2)
Slow WMA = WMA(Source, Length)
Hull Raw = 2 × Fast WMA - Slow WMA
Final Hull = WMA(Hull Raw, √Length)
This indicator keeps the same basic structure, but replaces the fixed compensation with an adaptive value between the selected
Indicatore
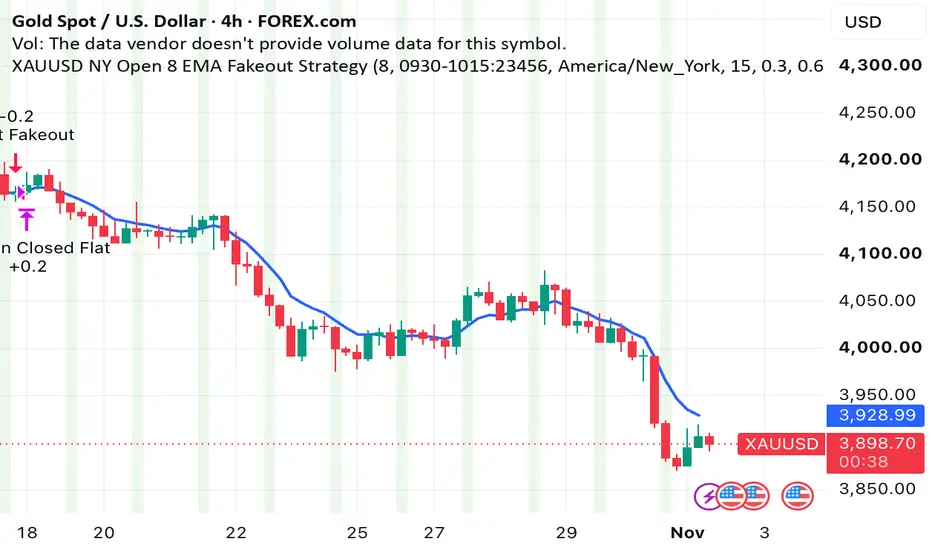
XAUUSD NY Open 8 EMA Fakeout StrategyThe NY Open 8 EMA Fakeout Strategy is a precision intraday momentum-reversal strategy designed specifically for high-volatility sessions like the New York market open. It targets "fakeouts"—liquidity grabs where price temporarily breaches an exponential moving average (EMA) before aggressively reclaiming direction in alignment with the higher timeframe (HTF) trend.
Key Features & Mechanics
Higher Timeframe Trend Filter:
Uses a multi-timeframe approach via request.security() (defaulting
Strategia
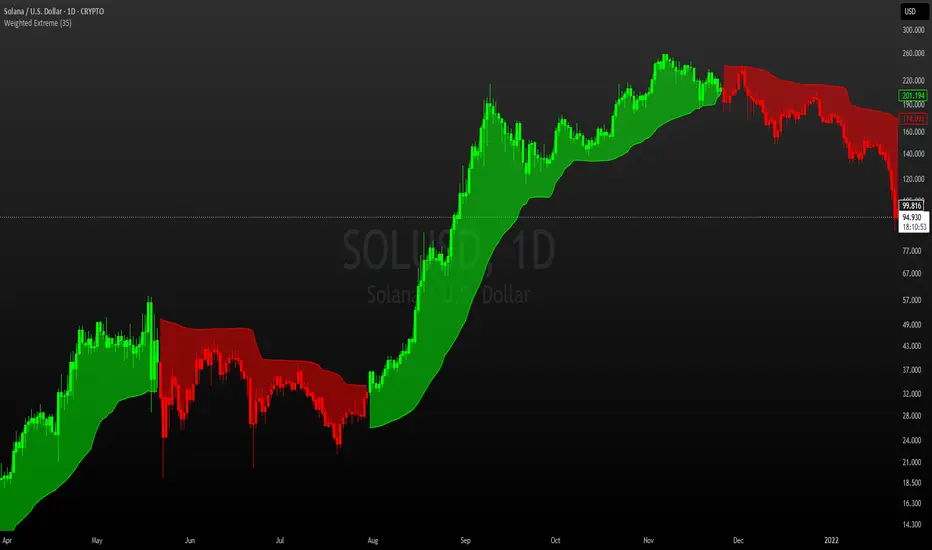
Weighted ExtremeWeighted Extreme | MisinkoMaster
The Weighted Extreme indicator constructs a dynamic, volatility-based channel designed to capture aggressive price breakouts and structural momentum extremes. Classical channel indicators often rely purely on moving averages or static standard deviations, which can lag behind rapid market expansion. By blending a Weighted Moving Average (WMA) with absolute price extremes—pairing WMA with the highest high for the upper boundary and the lowest low for the lower
Indicatore
HTF Bias Ribbon [FCD]What it shows
HTF Bias Ribbon draws two exponential moving averages (EMA) calculated on a higher timeframe (HTF = higher timeframe, default 60 minutes = 1H) directly on your lower-timeframe chart, fills the space between them with a color that reflects a simple trend state (UP / DOWN / NEUTRAL), and shows a status box with one plain line such as "▲ 1H trend: UP (for 14 bars)".
How to read it
- Look at the colored top line of the status box: green = 1H trend UP, red = 1H trend DOWN, gray = NEUTR
Indicatore
Open Range VeltrixOpen Range Veltrix is a free indicator that combines a New York opening range, a frozen opening-direction filter and an ordered breakout/retest/EMA200 entry signal. Its purpose is to keep these steps separate and visible, with one morning signal and reference risk levels. The default distances are intended for a NAS100 setup.
Use regular 1-minute candles for signals. A 5-minute chart is supported for viewing the opening candle, but entry signals are disabled there. Other intervals and nonstanda
Indicatore
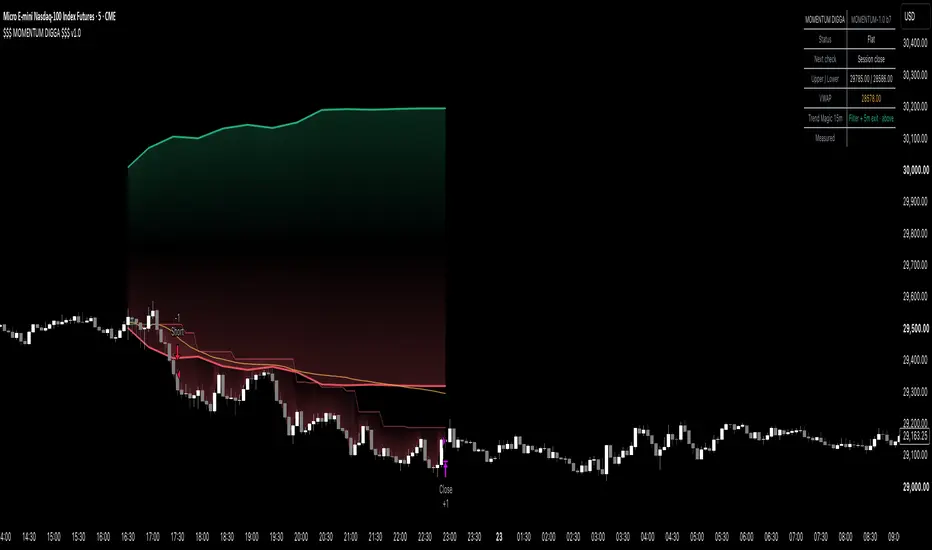
$$$ INTRADAY MOMENTUM DIGGA $$$ - Noise Area Breakout$$$ INTRADAY MOMENTUM DIGGA $$$ v1.0 - Noise Area Breakout
Most of the day the Nasdaq just makes noise. This strategy waits until price leaves the normal noise range for that time of day, then follows it until the close. It is built and measured on NQ futures, and it shows every number, the bad years included.
The idea comes from Zarattini, Aziz & Barbon (2024), "Beat the Market: An Effective Intraday Momentum Strategy". This is an independent build of that rule. Before publishing, its trad
Strategia
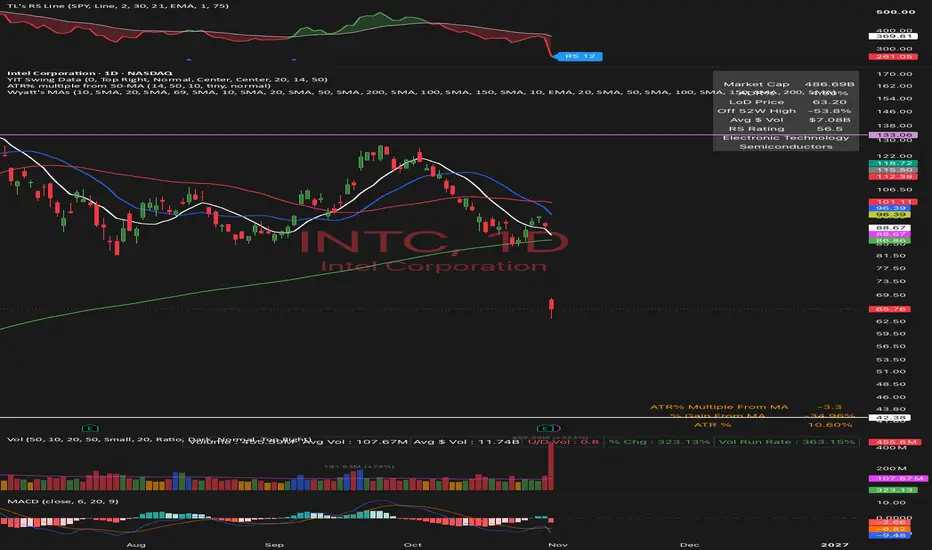
Wyatt's Key Moving Averages (MTF)Key Moving Averages (MTF) is an indicator that plots moving averages from several timeframes on one chart. Intraday MAs use the bars you’re viewing, while daily and weekly MAs are calculated on their own timeframes and projected onto any chart, so a 10-day SMA on a 30-minute chart reflects 10 days of closing prices instead of the last 10 half-hour bars. Each slot has its own on/off switch, period, MA type (SMA, EMA, WMA, or VWMA), color, and an optional “Lower TF” setting that controls whether a
Indicatore
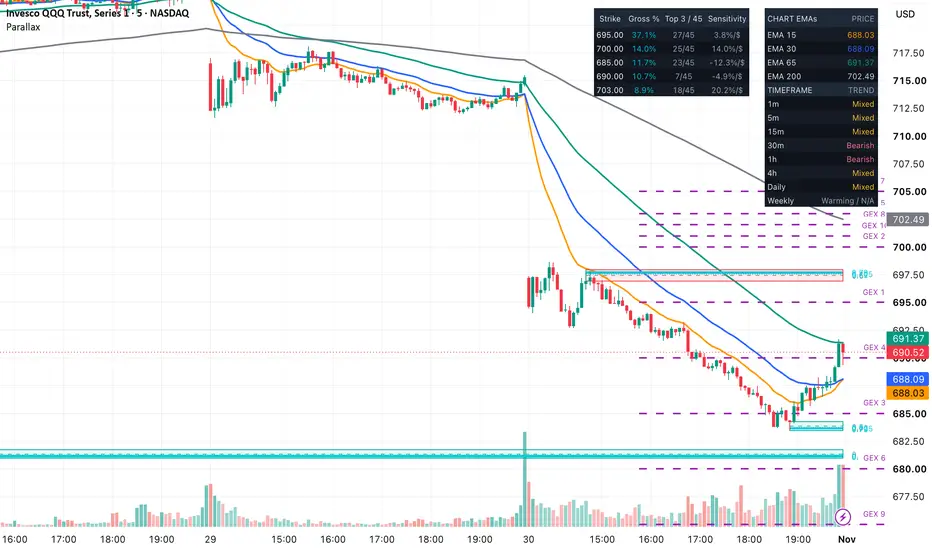
ParallaxParallax combines rejection blocks, Fibonacci reference levels, moving averages, volume, and options-gamma analysis in one TradingView indicator.
It is designed for manual chart analysis. You decide which areas matter, whether a price reaction is meaningful, and whether a trade fits your own rules. Parallax does not automatically place trades or guarantee profitable results.
The components work together to provide context: blocks identify potential reaction areas, EMAs describe trend alignment
Indicatore
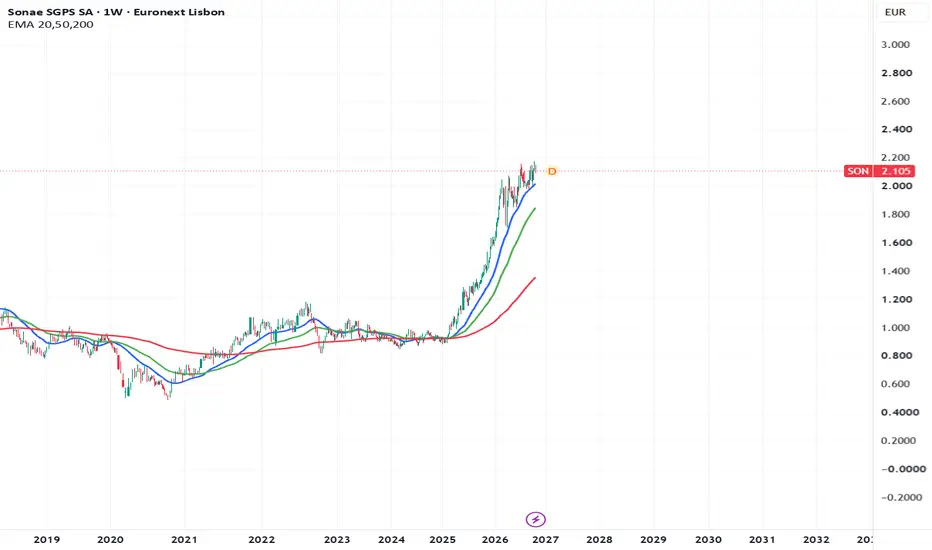
EMA 20,50,200EMA 20,50,200
This indicator displays three customisable Exponential Moving Averages (EMAs) directly on your chart, helping you compare shorter, medium, and longer-term price trends.
Default settings
20-period EMA: Blue
50-period EMA: Green
200-period EMA: Red
Price source: Close
Additional smoothing: 9-period EMA applied to each EMA
Additional smoothing reduces fluctuations and produces smoother lines, while increasing lag compared with standard EMAs.
Customisation
In Settings → Input
Indicatore
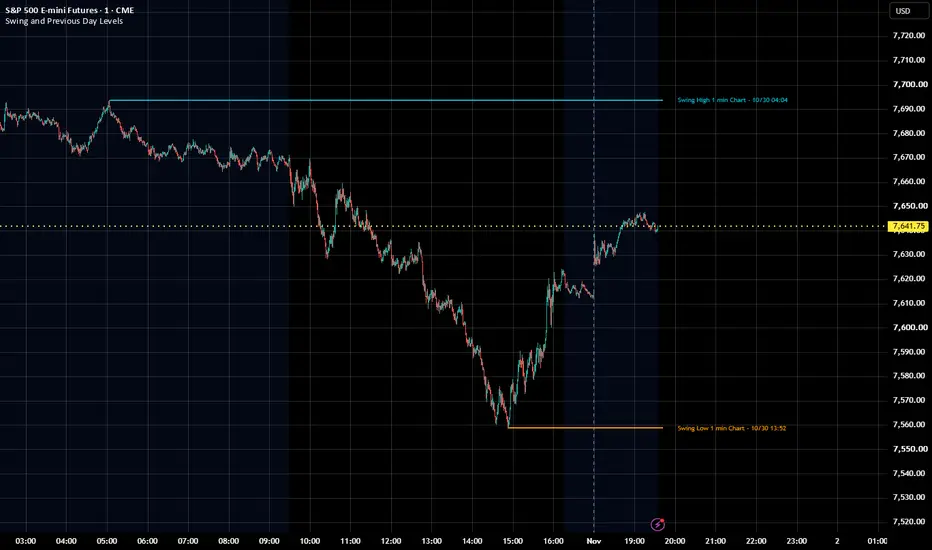
Swing and Previous Day Levels with LabelsKeep important price levels visible with descriptive labels that identify what each level represents and when it originated.
This indicator combines six manually configured levels, automatic previous-day levels, and optional EMA reference levels from the 5-minute, 15-minute, and 60-minute timeframes.
FEATURES
• Six manual levels with independent visibility, color, label text, price, and start date/time.
• Automatic previous-day high, low, and close, each independently selectable.
• Optional E
Indicatore
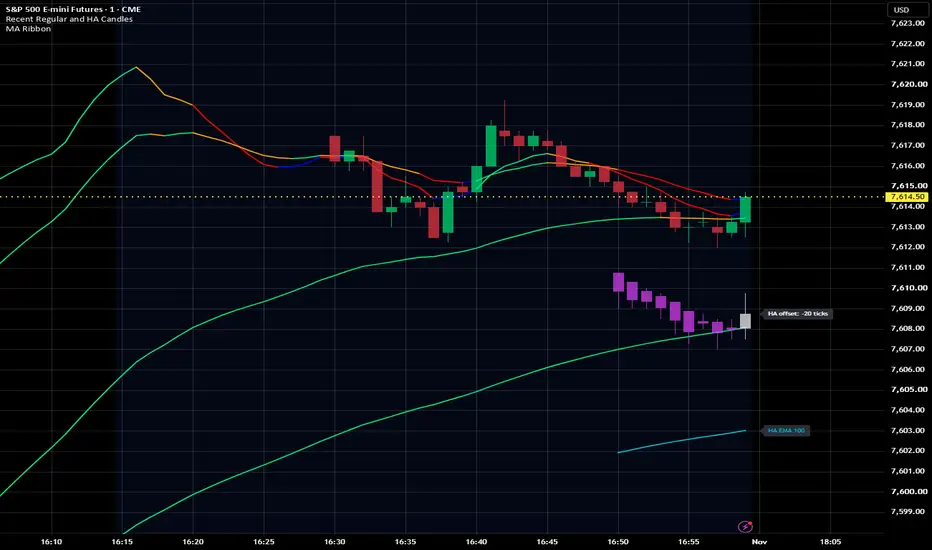
Recent Regular and HA CandlesDisplay recent price action while keeping the rest of your chart uncluttered.
This indicator displays a selectable number of regular candles, Heikin Ashi candles, or both. It is designed for traders who use moving average ribbons or other overlays to view trend history but still want recent candle structure visible.
FEATURES
• Independently enable regular and Heikin Ashi candles.
• Set a separate candle count, transparency, and bullish/bearish colors for each type.
• Apply independent vertica
Indicatore
Linear Regression with MA filterLinear Regression With MA Filter (LRMF)
INTRODUCTION
My first indicator the LRMF(Linear Regression With MA Filter) is a trend-following indicator that compares a linear regression line with a moving average. The regression line reacts from its nature quickly to the current direction of price. The moving average acts as a slower indicator. The relationship between the two gives a clear trend state and signals.
HOW IT WORKS
Linear regression line
On every bar, a least-squares line is fitted th
Indicatore
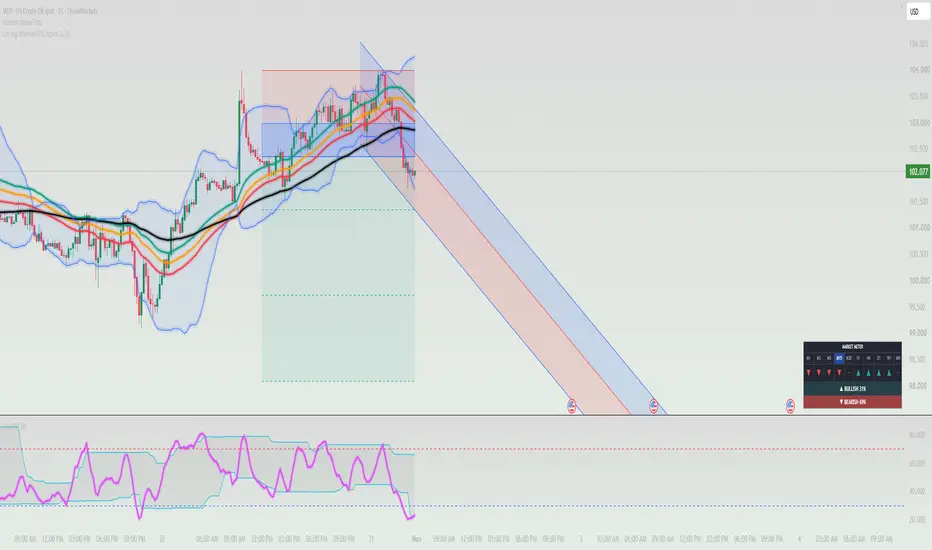
WTI TRADE 15M - BY JJS TRADER# WTI TF 15M ONLY by - JJS Trader
**A Dedicated Technical Analysis Tool for WTI Crude Oil Trading**
WTI TF 15M ONLY by - JJS Trader is a specialised chart analysis tool developed for traders who focus exclusively on WTI Crude Oil using the 15-minute timeframe (M15).
Designed with a structured and disciplined approach, this indicator helps traders interpret market conditions, recognise potential trading opportunities and make more informed decisions when analysing WTI price movements.
### WHY
Indicatore
TASC 2026.11 The UniEMA█ OVERVIEW
This script implements the "UniEMA" as presented by Igor Durkin the article "Managing Noise and Lag" from the November 2026 edition of TASC Traders' Tips . The UniEMA brings several methods of moving average construction into one system, allowing users to adjust smoothing and lag compensation by tuning parameters rather than switching between separate indicators.
█ CONCEPTS
There are many moving averages, each with their own characteristics providing a unique balance between s
Indicatore
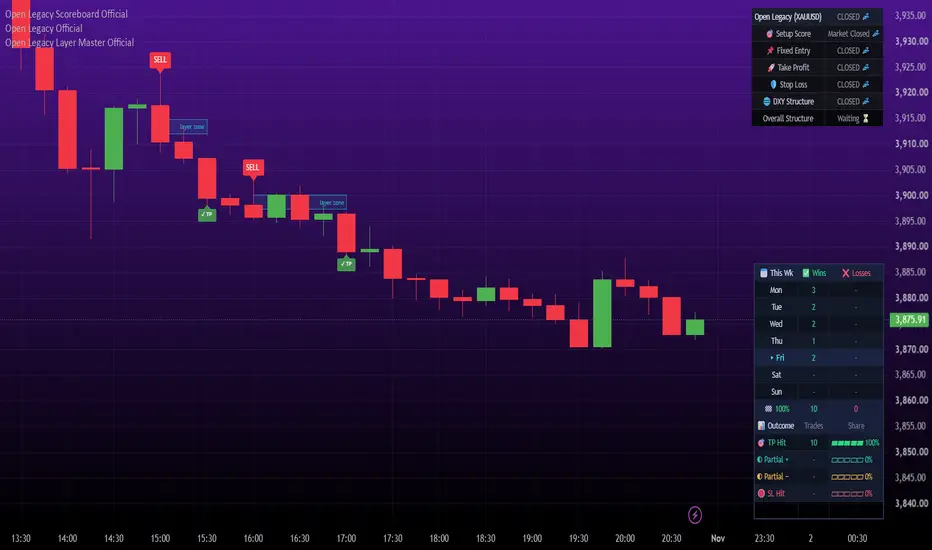
Open Legacy OfficialOpen Legacy Official
Open Legacy gives you a clear trade plan on your chart. When a setup is confirmed, it draws one fixed Entry, one Take Profit and one Stop Loss, then follows that trade until it finishes. The levels never move, so you always know exactly where you stand.
How it finds a setup
You choose one of two entry styles:
- FVG Pullback: waits for a recent fair value gap, then looks for price to pull back into it.
- EMA Trend: follows the trend using a fast and a slow moving average.
Indicatore
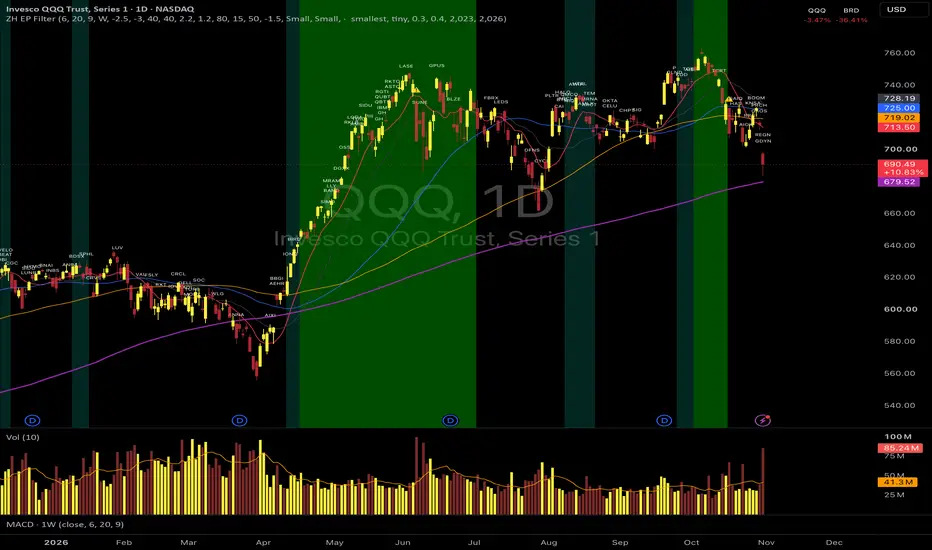
ZH EP Filter 001ZH EP Filter
A daily chart overlay for SPY or QQQ that shows EP history against the market regime. It plots 280 Episodic Pivots (EPs) from January 2023 to October 2026 on the same chart as the market's trend, so the two can be studied side by side.
WHAT'S ON THE CHART
EP labels: 280 EPs appear as tiny white ticker names above their dates. EPs on the same day stack vertically. Users can switch to dots, change the color, size, and spacing, and limit the range by year.
Background: green when th
Indicatore
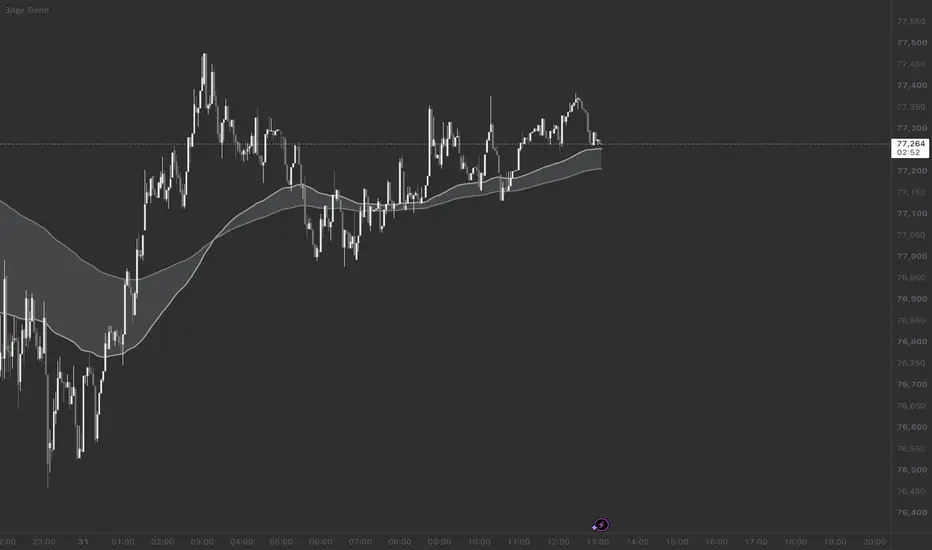
3dge Trend3dge Trend
3dge Trend plots the EMA 100 and EMA 200 as a single ribbon to give a clean, uncluttered view of the market’s longer-term trend structure.
How it works
Two exponential moving averages are calculated: a fast EMA (100) and a slow EMA (200).
The area between them is filled to form a ribbon, making the relationship between the two EMAs easy to read at a glance.
When the fast EMA is above the slow EMA, the longer-term structure is bullish. When it is below, the structure is bearish. Whe
Indicatore
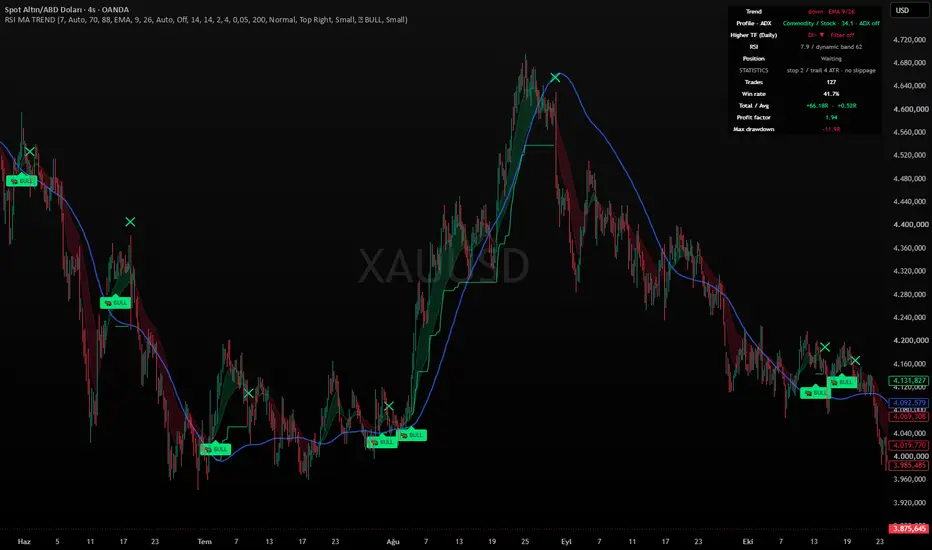
RSI MA Trend - Adaptive Profile EngineTITLE
RSI MA Trend - Adaptive Profile Engine
────────────────────────────────────────
DESCRIPTION (English)
RSI MA Trend is a long-only trend entry tool. It buys when RSI momentum breaks out while the moving-average trend is up, and manages the trade with an ATR trailing stop. What makes it different is that it does not use one setting everywhere: the trigger and the filters adjust themselves to the timeframe and to the asset class, and every one of those rules comes from measurement, not fro
Indicatore
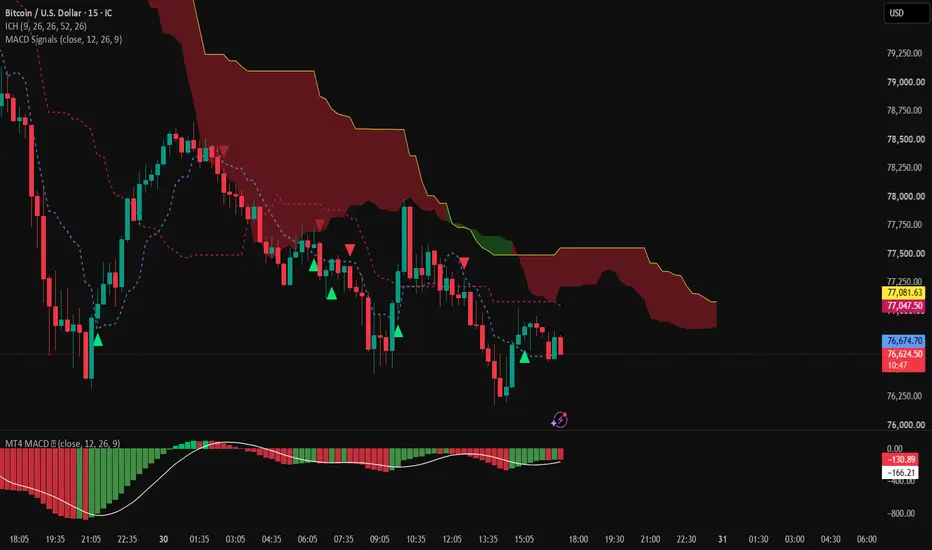
MT4 MACD Crossover Signals v2# MT4 MACD Crossover Signals
**Original Author: LucemAnb**
**Pine Script v6 Conversion & Modifications**
## Overview
MT4 MACD Crossover Signals is based on the original MT4 MACD indicator created by LucemAnb.
This modified version converts the original indicator to Pine Script v6 and introduces an additional feature: automatic identification of bullish and bearish MACD crossovers, displayed directly on the main price chart.
Unlike the original indicator, this version focuses exclusively o
Indicatore
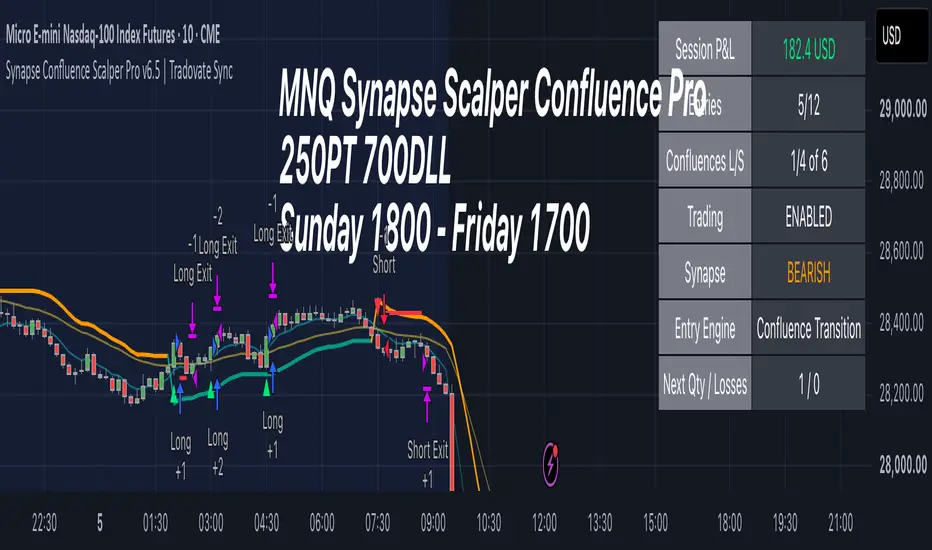
Overnight MNQ Synapse Confluence Scalper ProSYNAPSE SUPER SCALPER v6.3
OVERNIGHT MNQ FUTURES SCALPING STRATEGY
A multi-confluence, trend-adaptive futures scalping strategy designed and optimized through historical backtesting for the 10-minute MNQ chart, featuring intelligent Synapse trend detection, controlled martingale position sizing, and overnight profit and loss management.
==================================================
RECOMMENDED SETTINGS
==================================================
INSTRUMENT AND TIMEFRAME
Trading I
Strategia