Indicatore
Medie mobili

ULTIMATE SMC BREAKOUT AIThis is a Pine Script v5 trading indicator named "ULTIMATE SMC BREAKOUT AI". Summary of what it does and how it works:
Purpose
Detects breakout entries aligned with trend, plots suggested entry, stop-loss and two take-profit levels, highlights order blocks, an equilibrium line, and potential reversal zones. Provides alert conditions for buy/sell breakouts and reversal zones.
User inputs (configurable)
Fast/slow EMA lengths (default 50, 200)
ATR length and SL multiplier (default ATR14, SL = 1.2 * ATR)
TP1 and TP2 risk-reward multipliers (default 1.5 and 3.0)
Confirmation bars (default 2)
Toggles to show EMAs, Order Blocks, Equilibrium, Reversal Zones
Core logic
Trend filter: computes fast and slow EMAs. upTrend if EMA_fast > EMA_slow and price > EMA_fast; downTrend if EMA_fast < EMA_slow and price < EMA_fast. EMAs plotted if enabled.
Market structure breakout: defines a 20-bar swing high/low. A bullish breakout is price > prior swingHigh; bearish breakout is price < prior swingLow. A breakout must persist for confirmBars to be considered confirmed.
Entry signals: buySignal requires confirmed bullish breakout + upTrend; sellSignal requires confirmed bearish breakout + downTrend. buyFinal/sellFinal are first-bar triggers (only on the breakout bar).
ATR-based SL/TP: uses ATR to set SL distance (SL = entry ± ATR * slATR). Risk = distance entry↔SL. TP1 and TP2 set at entry ± (risk * tpRR).
Labels: when buyFinal/sellFinal occur the script places an on-chart label with ENTRY, TP1, TP2 prices.
Additional plotted/annotated elements
Order Blocks: highlights single-bar bullish order blocks (prior bar bearish, current close > prior high) and bearish order blocks (prior bar bullish, current close < prior low) as semi-transparent green/red boxes extending ~15 bars forward.
Equilibrium zone: plots mid-price of 50-bar highest high and lowest low (a yellow line).
Predictive Reversal Zones: marks potential reversal boxes when:
Liquidity sweep detected (current high > highest high of 10 bars prior OR current low < lowest low of 10 bars prior),
RSI conditions (RSI > 75 for bearish reversal, RSI < 25 for bullish reversal),
Candle direction confirming (bearish candle for bearish reversal, bullish for bullish reversal). These draw colored boxes and labels for "REVERSAL BUY/SELL ZONE".
Background color: faint green for upTrend, faint red for downTrend.
Alerts
Built-in alertconditions for BUY SIGNAL, SELL SIGNAL, Bullish Reversal, Bearish Reversal (triggerable in TradingView alerts).
Practical notes / behavior
Breakouts use a 20-bar swing lookback and require confirmationBars (default 2) — shorter/longer confirmation changes sensitivity.
SL/TP are purely mechanical from ATR—no partial fills, order execution logic, or trade management beyond TP1/TP2 drawn.
Order blocks detection is simplistic (single-bar pattern) and not a complex multi-bar block identification.
Reversal zones use a combination of liquidity sweep + extreme RSI + candle direction; they are predictive markers, not guarantees.
Designed for overlay on price; many plotted boxes/labels may clutter smaller timeframes or active instruments.
Indicatore

Candle Range Comparison OscillatorA great replacement for volume on cfd's since you cant get true volume there, also combined with volume on futures gives you a pretty strong signal when big players enter the market.
Candle Range Comparison Oscillator
Candle Range Comparison Oscillator
Candle Range Comparison Oscillator
Indicatore

AetherEdge - Hull MA Ribbon + Momentum Filter🖊️ Overview
AetherEdge Hull MA Ribbon + Momentum Filter is a next-generation trend visualization engine that fuses the ultra-low-latency characteristics of Hull Moving Averages (HMA) with a composite RSI+MACD momentum score. Six HMA ribbons trace price flow with smooth precision, while a 7-tier color gradient evolves dynamically with real-time momentum strength. This is a professional visual analysis tool that captures both direction and strength of trend at a glance.
🔶 Key Features
6-Line HMA Ribbon: Smooth, responsive trend visualization powered by ultra-low-latency Hull MA
RSI+MACD Composite Momentum Score: Weight-adjustable hybrid indicator
7-Tier Strength Categorization: Strong Bull / Bull / Weak Bull / Neutral / Weak Bear / Bear / Strong Bear
Perfect Stacking Detection: Identifies maximum trend strength via 6-line full alignment
Dynamic Gradient Coloring: Bold inner, fading outer—professional visual
Ribbon Alignment Filter: Suppresses signal false positives
Cross Signal Detection: Auto-marks trend reversal points
Integrated Dashboard: Momentum %, strength category, ribbon state at a glance
Dark Mode Support: AetherEdge premium UI
🧠 Technical Architecture
This indicator integrates Hull MA's mathematical superiority with multi-factor momentum analysis—a refined trend analysis system.
Hull MA Formula: HMA(n) = WMA(2*WMA(n/2) − WMA(n), sqrt(n))—solves traditional MA lag via double-WMA differential and sqrt-smoothing. Reaction speed approximately 2x that of EMA.
6-Line Ribbon Structure: baseLen + step×0–5 arithmetic progression. Gradient from short-term (h1) to long-term (h6), visualizing trend hierarchy.
Momentum Score Composition Logic:
RSI Normalization: (RSI − 50) / 50 mapped to -1 to +1
MACD Histogram Normalization: hist / stdev(hist, 100) standardized, clipped at ±3, divided by 3
Weighted Average: rsiWeight × RSInorm + (1−rsiWeight) × MACDnorm
Final output displayed as 0–100% momentum index
Ribbon Direction Detection: ribbonUp/Down determined by slope of central HMAs (h3, h4)
Perfect Stacking: h1>h2>h3>h4>h5>h6 full alignment certifies maximum trend strength
7-Tier Strength Classification:
+3 (Strong Bull): High momentum + up + perfect alignment
+2 (Bull): High momentum + up
+1 (Weak Bull): Mid momentum + up
0 (Neutral): No directional bias
−1 to −3: Symmetrical bearish judgment
Dynamic Coloring: Entire ribbon shifts across 7 colors based on strengthCat
⚙️ Recommended Settings & Tuning Guide
Crypto Defaults:
BTC (4H–Daily): baseLen=20, step=8, rsiWeight=0.5 (standard balance)
ETH (1H–4H): baseLen=15, step=6 prioritizing reaction speed
SOL (High-Vol): baseLen=25, step=10 for noise reduction
XRP (Range): strongLvl=70, weakLvl=30 for strict judgment
Tuning Guide:
Day Trading: baseLen=10-15, step=5, primary 1H/15M
Swing: baseLen=30-50, step=10 for macro trends
Scalping: baseLen=8, step=4 for ultra-short-term response
Momentum-Focused: rsiWeight=0.7 for higher RSI weight (effective in range)
Trend-Focused: rsiWeight=0.3 for higher MACD weight (strong trend detection)
Excess Signals: strongLvl=70+ for selectivity
Few Signals: strongLvl=60 + ribbonAlign=false to relax
💡 How to Use in Practice
★★★ STRONG BULL/BEAR: Maximum confluence, optimal for trend-following entries
Ribbon Expansion: Widening 6-line spread indicates trend acceleration—pullback long / rebound short recommended
Ribbon Contraction: Converging 6 lines = breakout precursor warning
Color Transition Points: Bull→Neutral→Bear shifts = early trend reversal alerts
Multi-Timeframe Synergy: Higher-TF Strong Bull + lower-TF pullback = perfect entry
AetherEdge Synergy:
Order Block + FVG Detector OB retest + Strong Bull color = ultra-high-conviction entry
Self-Evolving S/R Grid strong line + ribbon directional match = enhanced target precision
Squeeze Breaker breakout + ribbon expansion = trend continuation confirmation
Stop Loss: When price penetrates entire ribbon in opposite direction
⚠️ Important Notes
False Signals in Sideways Markets: Frequent color shifts in range; tune weakLvl/strongLvl
Ribbon Alignment Lag: Perfect stacking requires bar progression
MACD Normalization Period: Stdev calculation requires 100 bars; initial wait period
HMA Characteristics: Fast response carries overshoot risk in volatile moves
Hull MA Re-Entrance: Watch for minor reversals immediately after turning points
🚨 Disclaimer
This indicator is a technical analysis tool provided for educational and research purposes only and does not constitute financial advice. Trend and momentum evaluations based on historical price data do not guarantee future market behavior. All trading decisions are made at your own risk and should be accompanied by proper risk management.
Indicatore

Dynamic 5 & 25 MAThis indicator displays the 5 and 25 moving averages to help traders follow trend direction and market momentum. It gives a clear visual view of price movement on TradingView.
Indicatore

Indicatore

AetherEdge Reinforcement Filter MA🖊️ Overview
AetherEdge Reinforcement Filter MA is a self-evolving moving average powered by a genuine Q-learning algorithm. By dynamically learning across 9 market states and 5 smoothing actions, it autonomously selects the optimal reaction speed for current conditions — a true "thinking MA" that transcends the limitations of fixed-parameter legacy averages.
🔶 Key Features
Full Q-Learning Engine: 9 states × 5 actions = 45-cell Q-table
State Discretization: 2D regime classification via volatility × trend strength
5-Tier Action Space: Auto-selects from ultra-fast to ultra-slow smoothing
Dual-Objective Reward: Balances tracking error and jitter suppression
ε-greedy Strategy: Governs the exploration-exploitation tradeoff
5-Level Slope Coloring: Intuitive trend strength visualization
Adaptive α Display: Mini label showing current learned smoothing
Momentum Reversal Alerts: Real-time directional shift notifications
🧠 Technical Architecture
This indicator faithfully implements the canonical reinforcement learning framework.
State Space: ATR%-Z-score discretizes volatility into 3 tiers (low/mid/high), ATR-normalized momentum classifies trend into 3 tiers (down/range/up), forming a 3×3=9 state space.
Action Space: 5 smoothing coefficients ranging from a=0 (α≈0.40, ultra-fast) to a=4 (α≈0.04, ultra-slow), allowing the MA to switch reaction speeds based on regime.
Reward Function: reward = −(trackErr × wTrack + smoothErr × wSmooth). Dynamic weighting prioritizes tracking in trends and smoothness in chop, resolving the classic lag-vs-noise dilemma.
Q-Learning Update: Q(s,a) ← Q(s,a) + α — the standard Bellman update executes on every bar.
ε-greedy Selection: Explores randomly with probability ε, exploits the best known action otherwise — preserving adaptability to new regimes.
Parallel MA Computation: All 5 action-MAs are computed each bar; the selected one becomes the final output, enabling simultaneous evaluation and selection.
⚙️ Recommended Settings & Tuning Guide
Crypto Defaults:
BTC/ETH (4H–1D): BaseLen=20, α=0.15, γ=0.85, ε=0.10
SOL/XRP (1H): BaseLen=14, α=0.20, γ=0.80, ε=0.15 (high volatility)
Scalping (5M–15M): BaseLen=10, α=0.25, ε=0.05 (trust the learning)
Long Swing (1D–1W): BaseLen=50, α=0.10, γ=0.95 (deep discount)
Parameter Tuning:
Slow learning: Raise α to 0.20–0.30 for accelerated convergence
Excess noise: Lift γ to 0.90+ to prioritize long-term reward
New market/symbol: Increase ε to 0.20 for active exploration
Stable learning: Reduce ε to 0.03–0.05 to favor exploitation
💡 How to Use in Practice
Trend Following: Enter on Strong Up/Down color + price above/below RFMA
Exit Logic: Reduce on Flat slope, exit on opposite color emergence
Multi-Timeframe: 4H RFMA bias → 15M for precise entries
AetherEdge Combinations: Cluster Probability Line direction + RFMA slope alignment = elite conviction
Dynamic S/R: RFMA itself serves as a learning-based adaptive support/resistance
⚠️ Important Notes
Q-table initializes to zero — recommend a 200-bar warmup learning period
Learning resets on indicator reload (var variable behavior)
Excessive ε amplifies exploration noise; too low slows adaptation to new regimes
math.random() usage may cause minor recalculation drift on the same bar
🚨 Disclaimer
This indicator is provided for educational and research purposes only and does not constitute financial advice. All trading decisions are made at your own risk and should be accompanied by proper risk management. Past performance is not indicative of future results.
Indicatore

Indicatore

Indicatore

Neural Confluence Engine [Quantum Algo]Neural Confluence Engine
Neural Confluence Engine is a Pine Script v6 indicator that fuses eight independent technical factors — momentum, trend, VWAP position, RSI regime, MACD acceleration, ADX trend power, volume confirmation, and squeeze state — into a single weighted directional strength score on a 0–100 scale. Signals are gated by a user-configurable score threshold and an optional higher-timeframe trend filter before firing. The script is open-source. All signals are confirmed on bar close and do not repaint.
═══════════════════════════════════════════════════════════════════════
HOW IT WORKS
═══════════════════════════════════════════════════════════════════════
1. The eight factor model. Each bar, the engine evaluates eight independent factors and assigns each a normalized score between 0 and 1 based on its current state and intensity. Factors are scored separately for bullish and bearish directions.
2. WaveTrend Momentum (weight 1.5). Computes a custom oscillator from HLC3 smoothed by EMA of channel length (default 9) and signal length (default 12). Oversold reversals below -40 score 1.0; readings above zero score 0.8; positive crossovers below zero score 0.5.
3. EMA Alignment (weight 1.3). Triple EMA stack: fast (default 9) > slow (default 21) > baseline (default 50) scores 1.0 for full alignment. Fast > slow alone scores 0.6. Otherwise 0.
4. VWAP Position (weight 1.0). Price above VWAP by more than 1 ATR scores 1.0. Price above VWAP within 1 ATR scores 0.7. Below VWAP scores 0.
5. RSI Regime (weight 0.8). RSI above 60 scores 1.0. RSI between 50 and 60 scores 0.6. Below 50 scores 0.
6. MACD Histogram (weight 0.8). Rising histogram above zero scores 1.0. Positive but flat histogram scores 0.6. Negative histogram scores 0.
7. ADX Trend Power (weight 0.7). ADX above 40 scores 1.0. ADX between 25 and 40 scores 0.7. ADX below 25 scores 0.3 (penalty for chop, not zero).
8. Volume Confirmation (weight 1.0). Volume above 20-bar SMA combined with a directional candle close scores 1.0. Volume between 80% and 100% of average scores 0.4. Below scores 0.
9. Squeeze State (weight 1.2). Detects Bollinger Band compression inside Keltner Channels using length-20 standard deviation and ATR-10 envelopes. A "firing" bar (compression releases) with positive momentum scores 1.0. Compression without release scores 0.3.
10. Weighted aggregation and smoothing. Each directional factor is multiplied by its weight, summed, divided by total weight, and scaled to 0–100. The raw score is then smoothed with a 3-bar EMA to reduce single-bar noise. Bull score and Bear score are tracked separately. The net Neural Confluence Engine score is the difference between them.
═══════════════════════════════════════════════════════════════════════
SIGNAL TIERS
═══════════════════════════════════════════════════════════════════════
The script produces two signal tiers from the same scoring engine, allowing traders to choose between sensitivity and selectivity.
Standard signals (BUY / SELL). Fire on EMA ribbon color change — when the fast EMA crosses the slow EMA. These follow every directional shift regardless of score. Useful for systematic trend-following.
High-confluence signals (BUY+ / SELL+). Fire only when three conditions align simultaneously: an EMA cross occurs, the directional score exceeds the user-configurable threshold (default 60), and the higher-timeframe trend agrees with the signal direction. Used to filter for the most aligned setups.
Both signal tiers open trade management — entry, stop loss, three take-profit targets, and optional trailing stop after TP1.
═══════════════════════════════════════════════════════════════════════
TRADE MANAGEMENT
═══════════════════════════════════════════════════════════════════════
When a signal fires, the engine computes ATR-scaled risk levels relative to entry:
Stop loss: entry minus 1.5 × ATR (configurable multiplier 0.5–10).
TP1: 1R target (configurable risk-reward ratio).
TP2: 2R target.
TP3: 3R target.
When TP1 is reached, the stop converts to a trailing structure: SL moves to breakeven, then advances to TP1 level when TP2 is hit, then to TP2 level when TP3 is hit. The trailing stop also follows price at 0.5 × ATR distance after TP1. This can be disabled via the "Activate Trailing SL after TP1" toggle.
═══════════════════════════════════════════════════════════════════════
WHAT'S ACTUALLY DIFFERENT
═══════════════════════════════════════════════════════════════════════
◆ Eight-factor weighted composite, not a single trigger. Standard indicators fire on one condition — an EMA cross, an RSI level, a volume spike. The Neural Confluence Engine requires multiple independent factors to agree, weights them by historical reliability, and gates signals through a configurable score threshold. The trader can dial sensitivity from 20 (sensitive) to 95 (selective) without re-tuning eight separate sub-indicators.
◆ Two-tier signal architecture. Most indicators produce one stream of signals. This produces two from the same engine: standard ribbon flips for sensitive trend-following, and high-confluence variants gated by score + HTF agreement. Traders can use either tier independently or both in confluence.
◆ HTF agreement is built into the signal gate, not a separate filter. The higher-timeframe trend check is computed natively via request.security, auto-detected based on the chart timeframe (15m → 1H, 1H → 4H, 4H → D, D → W) or set manually. BUY+/SELL+ signals are blocked if HTF disagrees.
◆ Per-factor visibility in the dashboard. Each of the eight factors is individually viewable in real time — traders can see exactly which factors are contributing to the current score, rather than receiving a black-box signal. This is rare in confluence-style indicators which typically hide the sub-components.
◆ Trailing-stop ratcheting tied to TP hits. The trailing stop doesn't just follow ATR — it advances in tiers tied to take-profit milestones. After TP1, stop moves to breakeven. After TP2, to TP1. After TP3, to TP2. This protects profits at structurally meaningful levels rather than purely volatility-derived ones.
═══════════════════════════════════════════════════════════════════════
RECOMMENDED SETTINGS
═══════════════════════════════════════════════════════════════════════
Forex majors (EUR/USD, GBP/USD, USD/JPY) — 1H to 4H: Min Confluence Score 65, HTF Trend Filter on, SL Multiplier 1.5, TP R:R 1/2/3, HTF auto. Optimized for session-driven moves where structural levels respect institutional flow.
Crypto perpetuals (BTC, ETH, SOL) — 15M to 1H: Min Confluence Score 60, HTF Trend Filter on, SL Multiplier 2.0, TP R:R 1/2/3, HTF auto. Tuned for 24/7 markets with higher noise floors; the slightly wider stop accommodates increased wick volatility.
Gold (XAUUSD) — 1H to 4H: Min Confluence Score 70, HTF Trend Filter on, SL Multiplier 1.8, TP R:R 1/2/3.5, HTF set to Daily. Designed for the elevated wick activity around US session open and the tendency for sharp moves to develop after squeeze release.
Indices (SPX, NDX, DAX) — 5M to 1H: Min Confluence Score 55, HTF Trend Filter on, SL Multiplier 1.2, TP R:R 1/2/3, HTF auto. Tuned for cash-session structure and typical post-open momentum continuation.
Swing trading (any market) — 4H to Daily: Min Confluence Score 75, HTF Trend Filter on, SL Multiplier 2.5, TP R:R 1.5/3/5, HTF set to Weekly. Reduces noise to the highest-conviction setups only; wider targets to match the higher timeframe.
═══════════════════════════════════════════════════════════════════════
ALERTS & OUTPUTS
═══════════════════════════════════════════════════════════════════════
Alerts available:
BUY signal — ribbon flipped bullish (standard sensitivity)
SELL signal — ribbon flipped bearish (standard sensitivity)
BUY+ signal — high-confluence bullish setup
SELL+ signal — high-confluence bearish setup
Squeeze breakout — volatility compression released
TP1 reached — trailing stop activated
TP2 reached
TP3 reached
On-chart visuals:
EMA ribbon (5, 9, 13, 21, 34, 50) with fill bands colored by trend direction
VWAP plot with color reflecting price position
BUY / SELL / BUY+ / SELL+ signal labels at signal bars
Confluence score percentage label on BUY+ / SELL+ bars
Optional Entry / SL / TP1 / TP2 / TP3 horizontal lines for the most recent trade
TP-hit confirmation labels with checkmarks
Squeeze background highlight when compression is active
Diamond markers (⚡) on squeeze breakout bars
Optional momentum wave background colored by net score intensity
Optional candle coloring on signal bars
Multi-row dashboard with bull/bear scores, bias classification, HTF direction, factor states, trade status, and threshold setting
═══════════════════════════════════════════════════════════════════════
NOTES
═══════════════════════════════════════════════════════════════════════
Pine Script version: v6.
Repainting: All signals (BUY, SELL, BUY+, SELL+, squeeze breakouts, TP/SL hits) are evaluated on confirmed bar close and do not repaint. Higher-timeframe values use lookahead=barmerge.lookahead_off so HTF readings reflect only confirmed information available at signal time.
Compatibility: Works on all symbols and timeframes available in TradingView. Tested on forex majors, crypto perpetuals, gold, and major indices. Functions on stocks but the volume confirmation factor may require threshold adjustment for low-volume tickers. Functions on continuous contracts and CFDs.
Open-source: This script is open-source. Clone, study, and modify it freely under the terms of TradingView's House Rules. Republishing the source under a different name is not permitted.
Credits: This indicator's logic is independently developed. The component oscillators (WaveTrend, RSI, MACD, ADX, Bollinger Bands, Keltner Channels, VWAP) are standard public-domain technical analysis tools. The weighted-score aggregation methodology, two-tier signal architecture, ATR-tiered trailing stop progression, and per-factor dashboard are original implementations.
Disclaimer: This indicator is provided for educational and analytical purposes. Trading involves substantial risk of loss. Past performance does not guarantee future results. Position sizing and risk management are the trader's sole responsibility. Nothing in this script or description constitutes financial advice.
Indicatore

20 / 200 SMA Strategy - This Pine Script strategy is a 20 SMA / 200 SMA trend-following strategy designed for back testing and potential bot automation.
The main idea is to identify market direction using the relationship between the 20 simple moving average and the 200 simple moving average. When the 20 SMA is above the 200 SMA, the strategy looks for buy opportunities. When the 20 SMA is below the 200 SMA, it looks for sell opportunities.
The script includes three entry modes:
Original Cross Entry waits for the 20 SMA to cross the 200 SMA, then looks for price to close on the correct side of the 20 SMA.
Trend Pullback Entry allows entries after the market is already trending. For buys, the 20 SMA must be above the 200 SMA and price must cross back above the 20 SMA. For sells, the 20 SMA must be below the 200 SMA and price must cross back below the 20 SMA.
Relaxed Testing Entry is a more flexible testing mode that enters when price is on the correct side of the 20 SMA while the 20 SMA is on the correct side of the 200 SMA. This mode is useful for confirming that the strategy is working and producing trades.
The default risk management uses a 100-point take profit. The default stop loss is placed behind the last opposing candle beyond the 200 SMA. For a buy setup, the stop is placed below the last bearish candle below the 200 SMA. For a sell setup, the stop is placed above the last bullish candle above the 200 SMA. The user can also choose a fixed-point stop loss or recent swing stop.
The strategy includes optional filters such as a 200 SMA slope filter, candle-color confirmation, and a distance filter to avoid entries that are too far from the 20 SMA. It also plots the 20 SMA, 200 SMA, buy/sell labels, debug markers, and stop-loss/take-profit lines on the chart.
Overall, this script is built to help traders test a simple moving-average trend strategy while giving them flexibility to adjust entries, stops, profit targets, and filters based on the market or timeframe they are trading.
Strategia

Indicatore

Britz Minimalist Multiple Average + RSI AlertsHere we have, in a single TradingView indicator, 5 classic simple moving averages. Editable. I've added an orange alert (one dot) when the RSI enters overbought or oversold territory. A blue alert (one blue dot) when the RSI returns to the normal range.
Aqui dispomos em um único indicador do Trading View - 5 clássicas médias móveis simples. Editáveis. Agreguei a isso um alerta laranja ( um ponto ) quando o RSI entra em sobrecompra ou sobrevenda. Um alerta azul ( um ponto azul ) quando o RSI retorna para a zona de normalidade.
Indicatore

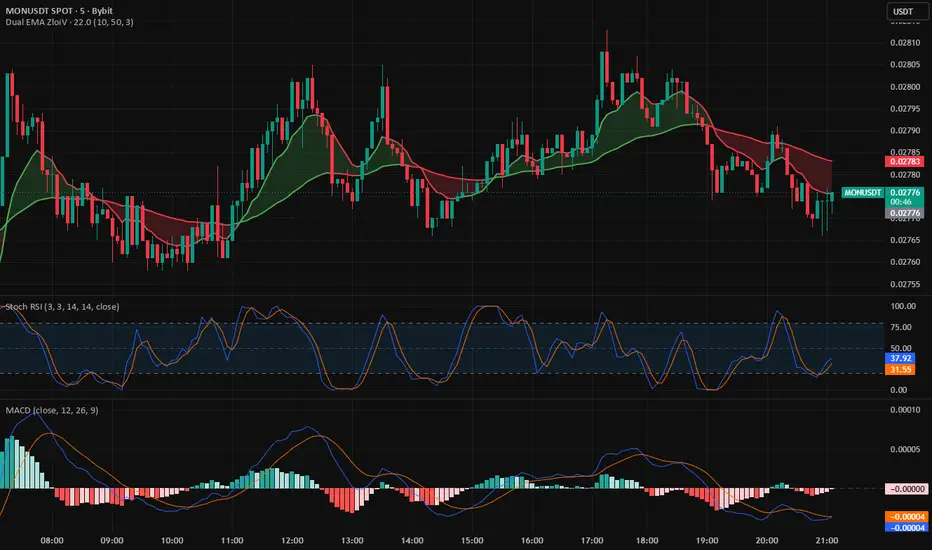
Dual EMA ZloiVOVERVIEW
Dual EMA ZloiV is a trend‑following indicator based on two exponential moving averages that color both the EMAs and the ribbon between them according to the current market direction. It is designed as a clean trend filter that quickly highlights bullish, bearish, and neutral phases without additional oscillators or visual noise.
FEATURES
Two customizable EMAs (fast and slow) with separate length and color settings for uptrend and downtrend, so you can adapt the tool to any market or timeframe.
Dynamic color change of each EMA depending on its slope and relative position, making trend shifts visually obvious on the chart.
Optional ribbon between the EMAs that reflects the overall trend direction (bullish/bearish/neutral) and helps you see momentum transitions at a glance.
Minimalistic design focused purely on trend visualization, so you can use it as a universal building block on top of your own strategies, entries and exits.
HOW TO USE
Use Dual EMA ZloiV as your primary trend filter: trade in the direction of the ribbon and EMA colors, and avoid or size down trades that go against the current trend.
Shorter EMA lengths work better for scalping and intraday trading, while longer lengths are more suitable for swing and positional setups.
Combine the indicator with your preferred entry tools (RSI, Stoch RSI, price action patterns, volume, etc.): Dual EMA ZloiV defines the direction, and other tools fine‑tune entries and exits.
LIMITATIONS
This script does not generate trade signals or execute orders; it only visualizes trend conditions based on two EMAs.
In choppy or low‑volatility markets the EMAs can frequently change color, so consider adding a separate trend/volatility filter (e.g., ADX, ATR, volume) in your system to reduce whipsaws.
Indicatore
9 EMA / VWAP + Sessions [NQ/MNQ]A combined trend bias and session awareness indicator built specifically for NQ/MNQ futures trading on the 5-minute chart.
9 EMA / VWAP Signal System:
Uses the crossover of the 9-period EMA and VWAP (Volume Weighted Average Price) to identify potential trend shifts with three-condition confirmation:
The cross — 9 EMA crosses above or below VWAP, signaling a shift in short-term momentum relative to the day's volume-weighted price
Price filter — price must be on the correct side of VWAP at the time of the cross. No longing below VWAP, no shorting above it
Slope confirmation — the 9 EMA must be actively rising for longs and falling for shorts, ensuring momentum is genuine and not just a flat cross
When all three conditions align a ▲ LONG or ▼ SHORT label fires on the chart. Crosses that don't meet all conditions appear as a small faded ⚠ label so you can see what was filtered and learn from it.
The background color reflects current bias at a glance — green when the 9 EMA is above VWAP, red when below. Optional VWAP standard deviation bands can be toggled on as natural support and resistance targets.
Key MNQ Session Times:
Vertical lines mark the six most important time events for MNQ futures traders:
⚡ 6:00 PM ET — Futures reopen, sets overnight direction
📊 8:30 AM ET — Economic data releases, expect volatility spikes
🗽 9:30 AM ET — NY cash open, highest volume of the day, strongest signals
🍽 12:00 PM ET — Lunch lull, volume dries up, choppy price action
📈 2:00 PM ET — Afternoon session, second momentum window of the day
🔔 4:00 PM ET — NY cash close, sharp moves common
All session lines and labels are fully toggleable individually. A subtle background highlight marks the core NY session from 9:30 AM to 4:00 PM ET.
Best used as a confluence tool — when a 9 EMA / VWAP signal fires near a key session open, especially the NY open or 8:30 AM data window, that's your highest probability setup of the day.
BUILT WITH CLAUDE AI
Indicatore

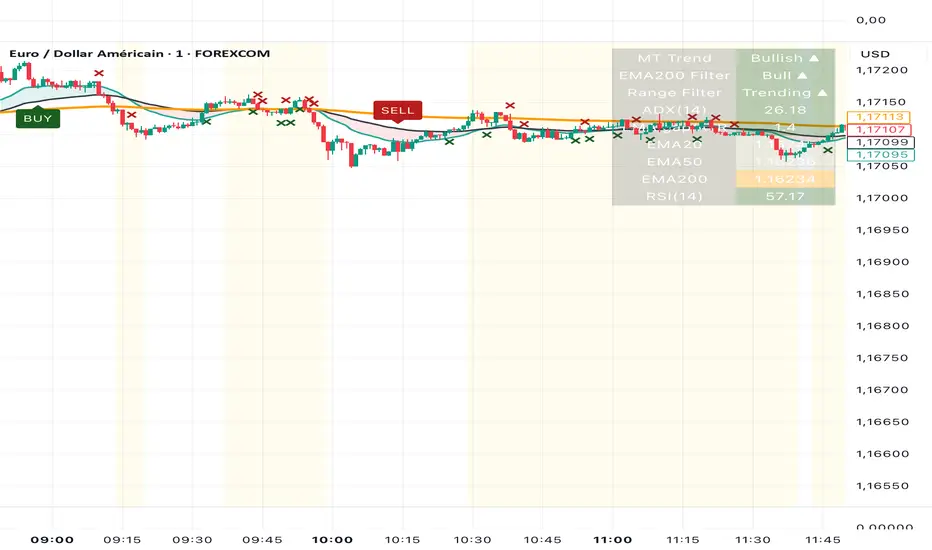
Mustang Algo EMA 20/50 Pullback+RSI Mustang Algo — EMA 20/50 Pullback + RSI + EMA 200 + Anti-Range Filter
A complete trend-following pullback system that combines four layers of confluence — short-term momentum (EMA 20), mid-term trend (EMA 50), long-term bias (EMA 200), and an anti-range filter — gated by RSI(14). The indicator trades both long and short with fully symmetric logic and provides granular control over signal frequency through multiple anti-spam mechanisms.
Core concept
In a trending market, price doesn't move in straight lines. It pulls back to dynamic support (the EMA 20) before resuming. This indicator detects those exact moments — when momentum is still intact (RSI confirms direction), the mid-term structure is aligned (EMA 20 above/below EMA 50), the long-term bias agrees (price or EMA 50 on the right side of EMA 200), and the market is genuinely trending (not chopping sideways) — and prints a signal only on the candle that confirms the rebound.
The hardest part of any pullback strategy is avoiding range markets, where the same logic that catches clean trend continuations produces a stream of losing trades. This version addresses that head-on with a dedicated anti-range layer.
How it works
LONG signal fires when EMA 20 is above EMA 50, the candle touches EMA 20 (wick or body, configurable), the close is above EMA 20 with a bullish body, RSI is above the long threshold, the EMA 200 filter is satisfied, and the anti-range filter confirms a trending environment.
SHORT signal is the exact mirror: EMA 20 below EMA 50, touch on EMA 20, bearish rejection candle, RSI below the short threshold, EMA 200 filter satisfied for shorts, and anti-range filter active.
Initial signals (INIT L / INIT S) mark the moment of the EMA 20/50 cross when all filters already agree — useful to catch the very first leg of a new trend before any pullback has formed.
Exits trigger on the opposite EMA 20/50 cross or when price closes beyond the EMA 50 (both toggleable independently).
EMA 200 trend filter — three modes
Price vs EMA 200 — standard: longs only above, shorts only below.
EMA 50 vs EMA 200 — structural: requires the mid-term EMA to be aligned with the long-term EMA. Fewer signals, higher conviction.
Both (strict) — requires both conditions simultaneously. Designed for swing setups and conservative profiles.
A tolerance setting (%) allows price to sit slightly on the wrong side of the EMA 200 without invalidating the signal — useful on FX and metals where price oscillates tightly around the long-term mean.
Anti-range filter — four modes
This is what separates a pullback indicator that works in trends from one that survives in real markets.
ADX — Classic Wilder ADX. Below the minimum threshold (default 20), the market is considered ranging and signals are blocked. Reliable on indices and crypto.
EMA distance — Measures the gap between EMA 20 and EMA 50 normalized by ATR. Below a configurable multiple (default 0.5×ATR), the EMAs are too close together, signaling consolidation. More reactive than ADX, ideal for gold and FX.
Choppiness Index — Dedicated chop measure on a 0-100 scale. Above the configurable maximum (default 61.8, the Fibonacci threshold), the market is choppy. Highest precision for pure ranges, best on D1 swing setups.
ADX + EMA distance (strict) — Default mode. Requires both ADX and EMA distance conditions simultaneously. ADX catches absolute weakness in directionality; EMA distance catches geometric compression. Each compensates for the other's blind spot. The two metrics together produce the cleanest signal set.
When the filter blocks the market, an optional yellow background highlights the ranging zones so you can calibrate your thresholds visually.
Signal frequency control
Two independent anti-spam layers let you fine-tune how aggressive the indicator is:
One signal per pullback (default ON) — A pullback is considered "consumed" after a signal fires. The setup must re-arm by moving N×ATR away from EMA 20 (default 0.5) before a new signal is allowed. Eliminates clustered signals during consolidation on the EMA 20.
Only first signal after EMA cross (default OFF) — Only the FIRST pullback signal after each EMA 20/50 cross is fired. Subsequent pullbacks in the same trend leg are ignored until a new cross occurs. Designed for swing traders who only want to enter at the start of a new trend.
Configurable inputs
Direction (LONG / SHORT toggles, independent)
EMA lengths (20 / 50 / 200) and source
EMA 200 filter mode and tolerance
Anti-range filter mode, ADX length and threshold, EMA distance multiplier, Choppiness length and threshold
RSI length and dual thresholds (long / short)
Touch mode (wick or body) and touch tolerance
Re-arm distance in ATR multiples
First-after-cross gating
Exit conditions (EMA cross / close beyond EMA 50)
Visual options (zone fill, EMA 200 background, range background, status table)
Built-in alerts
Seven alert conditions covering pullback BUY, pullback SELL, initial LONG, initial SHORT, LONG exit, SHORT exit, and a generic "any signal" alert. All messages include ticker, timeframe, and price.
Status table
A live readout in the top-right shows MT trend, EMA 200 filter state, range filter state, current ADX value, EMA gap/ATR ratio, the three EMA values, and current RSI — color-coded so the full setup state is readable at a glance.
Recommended settings by context
XAUUSD H1 — ADX min 18, EMA distance 0.4×ATR (gold moves fast, slightly more permissive)
EURUSD H1-H4 — ADX min 22, EMA distance 0.6×ATR (FX ranges often, stricter)
Indices D1 — ADX min 20, EMA distance 0.5×ATR (default values)
Crypto H4 — ADX min 25, EMA distance 0.7×ATR (erratic volatility, strictest)
For ultra-conservative swing entries: enable "Only first signal after EMA cross", set EMA 200 filter to "Both (strict)", and keep anti-range in default "ADX + EMA distance (strict)" mode.
Recommended timeframes
Works on any timeframe but performs best on H1 to D1 for swing setups, and M15 to H1 for intraday. On lower timeframes, increase the ATR re-arm distance and consider switching the touch mode to "Body" for higher quality signals.
Methodology notes
The indicator uses only standard, well-documented building blocks (EMA, RSI, ATR, ADX, Choppiness Index) — no black-box signals, no hidden repaint mechanics, no curve-fit thresholds. Every parameter is exposed and every decision is auditable from the source.
Signals are evaluated on bar close. The anti-range and anti-spam mechanisms are deterministic and use only past data, so backtests reflect real-time behavior.
Disclaimer
This is a technical analysis indicator, not financial advice. Always backtest on your specific instrument, timeframe, and broker spread before committing capital. Trend-following pullback strategies underperform in pure ranging markets — the multi-layer filtering mitigates this but does not eliminate it. Past performance does not guarantee future results.
— Mustang Algo
Indicatore