DSS Bressert - Trend, Valuation & Equity | Astral Vision DSS Bressert - Trend, Valuation & Equity | Astral Vision 🌠💠
The Double Smoothed Stochastic, developed by William Bressert, applies a double layer of EMA smoothing to a standard stochastic oscillator, producing a signal that is significantly less noisy than raw stochastics while retaining sensitivity to momentum shifts.
The result oscillates between 0 and 100, with crossovers between the DSS line and its trigger EMA identifying trend changes at the selected resolution.
This indicator extends the standard DSS with three distinct analytical layers:
Trend mode colors by bull/bear regime established at each DSS/trigger crossover, persisting the signal until the next cross.
Extremes mode activates only at overbought and oversold zones, filtering the middle ground.
The Equity view simulates a long-only strategy that holds when the DSS is in a bullish regime and exits to cash otherwise, displaying a cumulative equity curve alongside the price chart, translating the signal's historical performance into a directly readable return series.
Calculation ⚙️
`xPreCalc = EMA(Stochastic(close, high, low, period), EMAlen)`
`DSS = EMA(Stochastic(xPreCalc, xPreCalc, xPreCalc, period), EMAlen)`
`Trigger = EMA(DSS, TriggerLen)`
A bull regime is established when DSS crosses above the trigger and persists until the next bearish cross. In No Repaint mode, crossover signals are shifted by one bar to prevent intrabar repainting. The equity curve compounds close-to-close returns only during confirmed bullish regime bars, starting from a user-defined year at a base value of 100.
Plots 📊
DSS line and trigger line in the indicator panel, colored by active mode and regime (Indicator view)
Overbought and oversold threshold lines (Indicator view)
Equity curve starting from the configured year (Equity view)
Candle coloring on the price chart by DSS regime in both views
Inputs 🎛️
`View`: Indicator (DSS oscillator) or Equity (cumulative strategy curve)
`Mode`: Trend (regime-persistent coloring) or Extremes (overbought/oversold zones only)
`No Repaint`: shifts crossover signals one bar forward to eliminate intrabar repainting (Trend mode only)
`Equity Start Year`: anchor year for equity curve initialization (default 2019)
`Period`: stochastic lookback for both smoothing stages (default 10)
`EMA Length`: smoothing applied to each stochastic stage (default 9)
`Trigger EMA`: EMA of the DSS line used as crossover signal (default 5)
`Overbought / Oversold`: threshold levels for Extremes mode (defaults 90 / 10)
`Resolution`: timeframe at which DSS is computed (default 60 minutes)
Colors 🎨
5 Astral Vision presets + custom override. Default: Paradiso.
In Trend mode, positive color applies during bullish regimes and negative during bearish. In Extremes mode, positive color activates at overbought and negative at oversold, with neutral between thresholds.
Purpose 🎯
Standard stochastic indicators generate excessive crossover noise, particularly on lower timeframes, making regime identification unreliable without significant manual filtering.
The double smoothing of the DSS reduces that noise substantially, but most implementations still present only a raw oscillator with no mechanism for translating the signal into a persistent regime read or a measurable performance track record.
This indicator addresses both gaps.
The Trend mode converts the DSS crossover into a persistent regime signal that remains active until explicitly invalidated, removing ambiguity about the current directional bias.
The Equity view goes further: rather than asking the trader to visually backtest the signal, it computes and displays the cumulative return of following the DSS regime directly on the chart, making the signal's historical value immediately quantifiable without any external tools.
The configurable resolution allows the same indicator to serve as both an intraday momentum tool and a macro trend filter depending on the selected timeframe.
Disclaimer ⭕️
It is not financial advice, not an investment recommendation, and not affiliated with any financial institution, research firm, or organization of any kind. All content is provided for educational and informational purposes only. Always conduct your own research before making any financial decision. Indicatore

Indicatore

smart Stochastic Embedded RSI with HA, Supertrend & UT Bot Short Description
Advanced Stochastic + Embedded RSI with Heiken Ashi, Supertrend & UT Bot voting system for cleaner momentum detection and reduced fake signals. Designed for scalpers, intraday and swing traders.
Full Publish Description
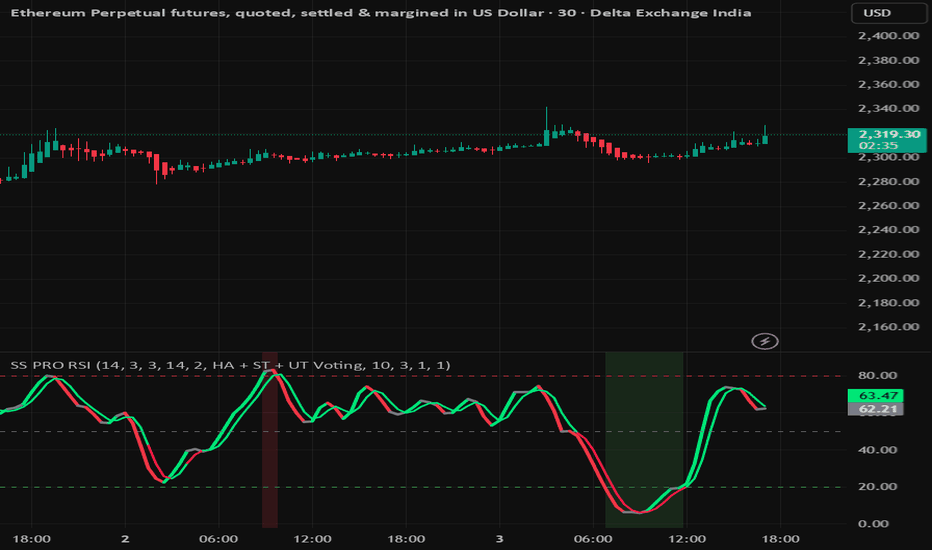
SS PRO RSI is a smart momentum oscillator built to reduce noise and filter weak signals by combining multiple confirmations into a single streamlined indicator.
This indicator merges:
Smart Stochastic
Embedded Stochastic RSI
Heiken Ashi trend logic
Supertrend confirmation
UT Bot filtering
Momentum-based coloring
Buy/Sell trigger system
Instead of relying on a basic stochastic crossover alone, the script uses a voting system between multiple trend filters to improve signal quality and reduce fake reversals during choppy markets.
Features
✔ Embedded Stochastic RSI mode
✔ Heiken Ashi trend confirmation
✔ Supertrend filter integration
✔ UT Bot confirmation logic
✔ Bull/Bear momentum coloring
✔ Dynamic trigger color modes
✔ Oversold & Overbought zones
✔ Cleaner buy/sell signals
✔ Adjustable sensitivity settings
✔ Designed for low-noise trading
Best Usage
Intraday trading
Swing trading
Index options
Crypto
Forex
Trend continuation setups
Recommended Timeframes
1H → Balanced signals
4H → Strong low-noise confirmations
15m → Faster entries with moderate noise
Suggested Settings (Low Noise)
K Length: 14
K Smoothing: 5
D Length: 5
RSI Length: 21
Momentum Sensitivity: 1.5
Important
⚠️ Disclaimer
This indicator is intended for educational and informational purposes only and should not be considered financial advice. Trading involves risk, and no indicator can guarantee profits or eliminate losses.
The signals generated by this script are based on technical analysis logic, momentum behavior, and multiple confirmation filters including Heiken Ashi, Supertrend, and UT Bot voting systems. Market conditions can change rapidly, and false signals may still occur.
Always use proper risk management, confirm trades with your own analysis, and test strategies before using them in live markets.
The creator of this script is not responsible for any financial losses or trading decisions made using this indicator.
Indicatore
Indicatore

In1 + In2 Dual Confirmation SignalsIn1 + In2 Dual Confirmation Signal Indicator
What It Tracks
This indicator is essentially a two-filter confirmation system designed to keep you out of low-quality trades. It combines two completely different approaches to reading the market — one tracks momentum and trend direction, the other tracks buying/selling pressure — and only fires a signal when both agree at the same time. Think of it like needing two different analysts to sign off on a trade before you take it.
The Two Engines
In1 — Stochastic SuperTrend
The first engine is a hybrid of two classic tools: the RSI and the Stochastic oscillator, fed into a SuperTrend framework.
Here's what it's doing under the hood:
It calculates the RSI of price, then runs a Stochastic calculation on that RSI (not on price directly). This smooths out a lot of noise.
That Stochastic RSI value is then used as the "price" input for a SuperTrend algorithm, which dynamically plots upper and lower bands and flips direction when the value breaks through them.
When the SuperTrend flips bullish and the Stochastic RSI is below 50 (not overbought), you get an In1 Buy arrow. When it flips bearish and the Stochastic RSI is above 50 (not oversold), you get an In1 Sell arrow.
The below/above 50 filter is important — it prevents the indicator from calling a bullish flip when momentum is already stretched high, and vice versa.
In2 — EVEREX (Engineered Volume & Price Flow)
The second engine is more sophisticated. It's measuring the quality and direction of buying vs. selling pressure on each candle by looking at multiple factors simultaneously:
How the candle closed relative to its range
The spread between open and close
How much price actually shifted
Volume weighting on all of the above
It normalizes all of these inputs and produces a single oscillator line. When that line flips from falling to rising, the background goes green (bulls taking over). When it flips from rising to falling, it goes red (bears taking over). The signal fires on those flip moments specifically — not while it's already trending in one direction.
How the Dual Confirmation Logic Works
This is where it gets smart. The indicator doesn't require both signals on the exact same candle — that would be too restrictive and you'd miss a lot of valid setups. Instead, it uses a lookback window:
For a BUY signal to fire:
In1 must have printed a bullish arrow on this candle OR within the last 1–2 candles
AND if In1 fired 1–2 bars ago (not this candle), the Stochastic RSI line must still be rising — confirming the momentum hasn't already reversed
AND In2 must flip green on this candle (that's the confirmation trigger)
For a SELL signal to fire:
Same logic in reverse — In1 bearish arrow within 1–2 candles, Stoch RSI still falling, In2 flips red
The B/S label prints on the candle where In2 flips — that's your entry candle.
Adjusting Signal Frequency
To get MORE signals (more sensitive, more trades, more false positives):
Lower the ST Multiplier (default 10) — a smaller multiplier makes the SuperTrend flip more often
Lower the RSI Length (default 10) or K (default 7) — shorter lookbacks react faster
Lower the EVEREX Length (default 10) or Signal Length (default 5) — the EVEREX oscillator will flip more frequently
To get FEWER signals (more selective, higher quality, fewer trades):
Raise the ST Multiplier — SuperTrend becomes harder to flip, only strong moves qualify
Raise the RSI Length and K — smoother, slower momentum readings
Raise the EVEREX Lookback (default 20) — the volume normalization uses a longer baseline, making it harder for a single candle to register as significant
Raise the EVEREX Length and Smooth — the oscillator becomes less twitchy
The Timeframe input is also huge — running In1 on a higher timeframe than your chart while watching In2 on the current chart creates a natural multi-timeframe filter that dramatically reduces noise.
How Alerts Work
There's a single alert condition called "In1+In2 Signal" that fires on either a Buy or Sell signal. When you set up the alert in TradingView, set it to "Once Per Bar Close" for confirmed signals, or "Once Per Bar" if you want real-time notification (more on that below). The message simply tells you a dual confirmation signal fired and to check the chart for the B/S label.
Real-Time vs. After Close — The Repainting Question
This is the most important thing for any trader to understand about this indicator.
In2 (EVEREX) is fully real-time and does NOT repaint. It's calculated purely from current bar data — price action, spread, volume — so what you see on the forming candle is what you get. If it flips green mid-candle, that flip is real.
In1 has a setting called "Wait for Timeframe Close." This is critical:
When turned ON — In1 only updates when the selected timeframe candle fully closes. The SuperTrend flip is confirmed and will not repaint. This is the safer setting for signal reliability.
When turned OFF — In1 updates in real time using lookahead. You'll see signals earlier, but if the higher timeframe candle closes differently than it looked mid-bar, the signal can vanish. This is the classic repainting scenario.
The 1–2 bar lookback window for In1 is also non-repainting because it uses dir , bars_since_up, and direction tracking that are all based on closed bar values — once a bar closes, those values are locked. So a signal that printed on a closed candle will stay there.
Bottom line for your workflow: Run "Wait for Timeframe Close" set to ON and set your alert to "Once Per Bar Close" — every signal you see on a closed candle is confirmed and won't disappear on you. Indicatore

Indicatore

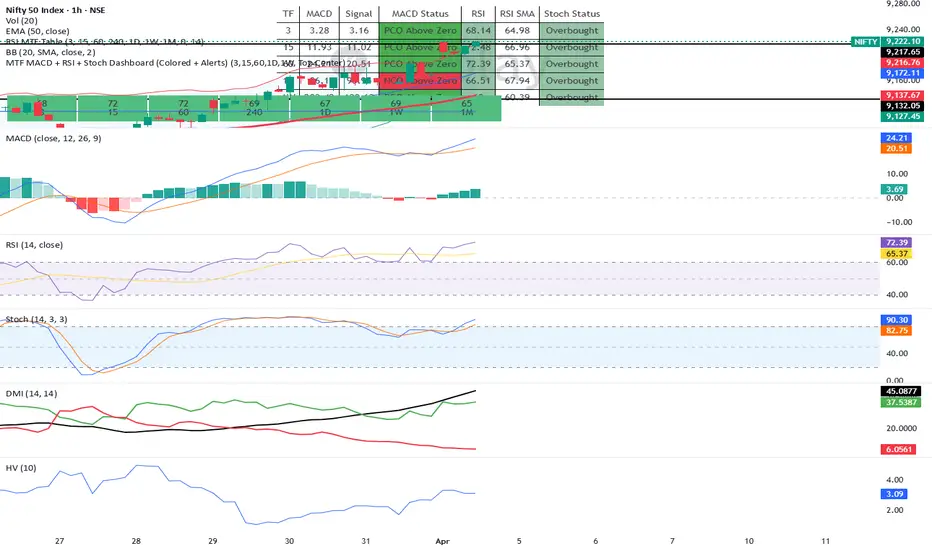
EagleEye-DashboardIndicator Description & Disclaimer
This indicator has been developed independently for educational and personal learning purposes, based on hands-on trading experience and continuous research into multi-timeframe analysis.
What this indicator does:
This tool consolidates three of the most widely used technical indicators — MACD, RSI, and Stochastic Oscillator — into a single, clean dashboard view. Rather than switching between multiple charts and timeframes manually, traders can now see the status and alignment of all three indicators across multiple timeframes (MTF) at a single glance. This helps in quickly identifying trend confluence, momentum shifts, and potential entry/exit zones without cluttering your chart.
Key features:
Multi-Timeframe (MTF) dashboard view in one unified panel
Real-time status display for MACD, RSI, and Stochastic
Designed for clarity, speed, and ease of interpretation
Suitable for indices, equities, forex, and crypto markets
Disclaimer:
This indicator is strictly developed for learning and informational purposes only. It does not constitute financial advice, investment recommendation, or a solicitation to buy or sell any financial instrument. Past performance of any signal generated by this indicator does not guarantee future results. Trading in financial markets involves substantial risk, and you may lose more than your initial investment. Always conduct your own due diligence, apply proper risk management, and consult a certified financial advisor before making any trading decisions.
The author holds no responsibility for any trading losses incurred through the use of this indicator. Use at your own risk.
Future Roadmap:
This indicator is actively being refined. Upcoming versions will aim to improve signal accuracy, add additional confirmation layers, and expand timeframe flexibility based on user feedback and ongoing research.
Developed with passion for the trading community.
Regards,
Ramesh Vaishya
Independent Trader & Indicator Developer Indicatore

EagleView - MACD+RSI+StochIndicator Description & Disclaimer
This indicator has been developed independently for educational and personal learning purposes, based on hands-on trading experience and continuous research into multi-timeframe analysis.
What this indicator does:
This tool consolidates three of the most widely used technical indicators — MACD, RSI, and Stochastic Oscillator — into a single, clean dashboard view. Rather than switching between multiple charts and timeframes manually, traders can now see the status and alignment of all three indicators across multiple timeframes (MTF) at a single glance. This helps in quickly identifying trend confluence, momentum shifts, and potential entry/exit zones without cluttering your chart.
Key features:
Multi-Timeframe (MTF) dashboard view in one unified panel
Real-time status display for MACD, RSI, and Stochastic
Designed for clarity, speed, and ease of interpretation
Suitable for indices, equities, forex, and crypto markets
Disclaimer:
This indicator is strictly developed for learning and informational purposes only. It does not constitute financial advice, investment recommendation, or a solicitation to buy or sell any financial instrument. Past performance of any signal generated by this indicator does not guarantee future results. Trading in financial markets involves substantial risk, and you may lose more than your initial investment. Always conduct your own due diligence, apply proper risk management, and consult a certified financial advisor before making any trading decisions.
The author holds no responsibility for any trading losses incurred through the use of this indicator. Use at your own risk.
Future Roadmap:
This indicator is actively being refined. Upcoming versions will aim to improve signal accuracy, add additional confirmation layers, and expand timeframe flexibility based on user feedback and ongoing research.
Developed with passion for the trading community.
Regards,
Ramesh Vaishya
Trader & Indicator Developer Indicatore

EagleView-MACD+RSI+StochIndicator Description & Disclaimer
This indicator has been developed independently for educational and personal learning purposes, based on hands-on trading experience and continuous research into multi-timeframe analysis.
What this indicator does:
This tool consolidates three of the most widely used technical indicators — MACD, RSI, and Stochastic Oscillator — into a single, clean dashboard view. Rather than switching between multiple charts and timeframes manually, traders can now see the status and alignment of all three indicators across multiple timeframes (MTF) at a single glance. This helps in quickly identifying trend confluence, momentum shifts, and potential entry/exit zones without cluttering your chart.
Key features:
Multi-Timeframe (MTF) dashboard view in one unified panel
Real-time status display for MACD, RSI, and Stochastic
Designed for clarity, speed, and ease of interpretation
Suitable for indices, equities, forex, and crypto markets
Disclaimer:
This indicator is strictly developed for learning and informational purposes only. It does not constitute financial advice, investment recommendation, or a solicitation to buy or sell any financial instrument. Past performance of any signal generated by this indicator does not guarantee future results. Trading in financial markets involves substantial risk, and you may lose more than your initial investment. Always conduct your own due diligence, apply proper risk management, and consult a certified financial advisor before making any trading decisions.
The author holds no responsibility for any trading losses incurred through the use of this indicator. Use at your own risk.
Future Roadmap:
This indicator is actively being refined. Upcoming versions will aim to improve signal accuracy, add additional confirmation layers, and expand timeframe flexibility based on user feedback and ongoing research.
Developed with passion for the trading community.
Regards,
Ramesh Vaishya
ASTA Student -Trader & Indicator Developer Indicatore

AG Pro Stochastic Exhaustion Map [AGPro Series]AG Pro Stochastic Exhaustion Map
OVERVIEW
AG Pro Stochastic Exhaustion Map is not designed as a classic overbought / oversold reversal script.
This tool uses a stochastic framework to map trend maturity, extension pressure, momentum fatigue, and reset behavior. The objective is not to label every extreme reading as a turning point. Instead, the script is built to show whether a move still looks fresh, whether it is becoming stretched, whether exhaustion risk is increasing, or whether the market is moving through a reset phase after an extended run.
That distinction is important. In strong trends, stochastic values can remain elevated or depressed for long periods. This script does not assume that an extreme reading automatically means the move should reverse. It treats those conditions as contextual information and then evaluates whether the move still has healthy drive, whether it is becoming late-stage, or whether the structure is normalizing.
The result is a state-based reading model rather than a basic signal-only oscillator. The emphasis is on chart context, trend maturity, and fatigue mapping.
WHAT THIS SCRIPT DOES
This script organizes stochastic behavior into a compact state model built around five practical conditions:
• Build-Up
• Drive
• Stretch
• Exhaustion Risk
• Reset
These states are not intended to predict exact tops or bottoms. They are designed to help the user evaluate where the current move may sit within its broader development cycle.
In practical terms, the script focuses on questions such as:
• Is the move still behaving like an active and healthy expansion?
• Has the move become stretched?
• Is momentum support beginning to weaken?
• Has the market started to normalize after an extended push?
• Is current behavior better described as continuation pressure or late-stage fatigue?
That is the core purpose of the indicator.
UNIQUE EDGE
The unique edge of this script is that it does not reduce stochastic analysis to simple line crosses or fixed threshold reactions.
Instead of treating the oscillator as a binary overbought / oversold tool, the script uses it as a context engine for reading trend fatigue. The internal logic emphasizes four broad components:
1) Persistence in extreme zones
How long the oscillator remains in an extended area matters. Persistence alone is not treated as a reversal condition, but prolonged persistence can indicate that a move is progressing into a more mature phase.
2) Momentum decay
A move can remain extended while its internal strength starts to weaken. The script evaluates whether the oscillator is still advancing with conviction or whether follow-through is becoming less efficient.
3) Push efficiency
Price can continue expanding while oscillator quality becomes less supportive. That mismatch can be relevant when assessing whether the move still looks healthy or whether it is becoming increasingly vulnerable to a reset.
4) Reset behavior
After extended conditions, the market often goes through a normalization phase. The script attempts to identify when that process is occurring so the user can distinguish late-move fatigue from post-extension reset behavior.
Together, these components form a stochastic-based exhaustion map instead of a traditional threshold trigger script.
HOW IT WORKS
The script begins with a smoothed stochastic structure and then builds a higher-level state model on top of it.
The model evaluates:
• extreme-zone persistence
• directional decay in stochastic slope
• push-efficiency deterioration
• reset-zone normalization
Those components are blended into an Exhaustion Score, which is then interpreted through the state engine.
The state engine classifies the current condition as one of the following:
Build-Up
An early or re-engaging phase where activity is present but extension pressure is still relatively modest.
Drive
An active expansion phase where the move still appears supported and not yet meaningfully fatigued.
Stretch
A more mature condition where extension is becoming more visible and the move should be read with greater caution.
Exhaustion Risk
A late-stage condition where extension and internal weakening combine strongly enough to raise fatigue risk.
Reset
A normalization phase following recent extreme behavior, where the market is no longer best described as active drive or rising exhaustion.
This is why the script should be read as a contextual map rather than a standalone trade-decision engine.
SUMMARY PANEL
The panel is designed to keep the reading compact and practical. It includes:
• current state
• directional bias
• exhaustion score
• persistence profile
• decay profile
• reset quality
• context label
The panel is not intended to replace chart reading. It is there to summarize the current exhaustion model in a clean format.
HOW TO INTERPRET THE STATES
Build-Up
Early participation or reactivation. The move is not yet heavily stretched.
Drive
The move appears active and supported. This does not mean it must continue. It simply means the exhaustion model is not yet describing the condition as late-stage.
Stretch
The move is becoming more mature. This is a cautionary condition rather than an automatic reversal condition.
Exhaustion Risk
The model is detecting stronger signs of extension plus weakening support. This still does not guarantee reversal. It indicates that late-stage fatigue risk is becoming more relevant.
Reset
The market is moving away from an extended condition and toward normalization. This state can be useful when separating active fatigue from post-extension cooling.
ALERTS
Alerts are state-based and intentionally descriptive. They are designed to notify the user when the model shifts into meaningful phases such as Build-Up, Stretch, Exhaustion Risk, or Reset.
These alerts should be interpreted as contextual transitions rather than direct instructions.
HOW THIS DIFFERS FROM AG PRO RSI PRESSURE MAP
This difference should be understood very clearly.
AG Pro RSI Pressure Map is centered on pressure.
AG Pro Stochastic Exhaustion Map is centered on fatigue.
RSI Pressure Map focuses on whether directional pressure is building, holding, or weakening. Its primary reading axis is pressure intensity and directional dominance.
Stochastic Exhaustion Map focuses on whether a move is fresh, extended, maturing, fatigued, or resetting. Its primary reading axis is trend maturity and exhaustion state.
Put simply:
• RSI Pressure Map asks: which side is applying pressure?
• Stochastic Exhaustion Map asks: how mature or fatigued is the move?
That is not a small wording difference. It changes the analytical role of the script.
A user looking for pressure development, directional participation, or pressure persistence would generally be closer to the RSI Pressure Map framework.
A user looking for extension maturity, late-stage risk, and reset behavior would generally be closer to the Stochastic Exhaustion Map framework.
So even though both tools operate in the broader momentum / context space, they are not the same type of instrument and they are not trying to answer the same question.
HOW THIS DIFFERS FROM CLASSIC STOCHASTIC SCRIPTS
This script is not built as a standard stochastic crossover tool.
It is not built as a basic 80 / 20 reversal script.
It is not built as a simple divergence detector.
Many conventional stochastic scripts are primarily concerned with:
• K / D crossovers
• overbought and oversold threshold events
• simple turn signals from extreme zones
This script takes a different route.
Here, an extreme reading is not automatically treated as a reversal signal.
A crossover is not the main event.
The main objective is to describe the condition of the move itself: active, stretched, fatigued, or resetting.
That distinction is fundamental.
HOW THIS DIFFERS FROM AG PRO STRUCTURAL MOMENTUM OSCILLATOR
Structural Momentum Oscillator is more directly concerned with momentum structure and directional behavior inside the move.
Stochastic Exhaustion Map is more concerned with where the move stands in its lifecycle.
In simplified terms:
• Structural Momentum Oscillator = structure and momentum character
• Stochastic Exhaustion Map = maturity and exhaustion character
The overlap is limited because the purpose is different.
HOW THIS DIFFERS FROM AG PRO MACD DRIFT FILTER
MACD Drift Filter is centered on drift quality and directional continuation behavior through a MACD-derived lens.
Stochastic Exhaustion Map is not trying to grade drift quality in that way. Its emphasis is on extension maturity, internal fatigue, and reset conditions within a stochastic state framework.
So the user should not think of this script as a MACD variant with a different formula. The conceptual job is different.
HOW THIS DIFFERS FROM GENERIC MEAN REVERSION TOOLS
This script does not attempt to force a mean reversion call every time the market becomes extended.
It explicitly allows for the reality that strong moves can remain extended for longer than expected. The goal is to map the transition from healthy extension to increasing fatigue risk, not to declare that every extreme must immediately reverse.
That design choice is central to the script.
LIMITATIONS AND TRANSPARENCY
This script has important limitations.
First, extreme stochastic conditions can persist during strong trends. For that reason, an elevated reading should not be interpreted as an automatic turning point.
Second, exhaustion risk is not the same as reversal confirmation. A market can look stretched and still continue.
Third, reset behavior should be read as normalization context, not as a guaranteed reload condition.
Fourth, no single oscillator should be used in isolation. This script is intended to complement market structure, trend context, support / resistance analysis, volatility conditions, and the user's broader workflow.
The model is deterministic, but deterministic does not mean certain. It means the same conditions will produce the same classification logic.
RISK DISCLOSURE
This indicator is a chart-analysis and contextual state-mapping tool.
It is not a prediction engine.
It is not financial advice.
It should not be used as the sole basis for entries, exits, or risk decisions. Indicatore

Inertial Stochastic [LuxAlgo]The Inertial Stochastic indicator introduces a novel approach to oscillator smoothing by implementing "Forced Persistence," a technique that achieves stability at the mathematical source rather than through traditional lagging filters. By dynamically optimizing the lookback period on every bar to minimize the variation between consecutive values, the tool effectively creates an inertial effect that resists erratic market noise and "sawtooth" fluctuations. This provides a significant advantage over standard oscillators, as it maintains a high degree of smoothness and trend coherence without the heavy group delay typically introduced by long-period moving averages, allowing traders to stay positioned in trends while identifying overbought or oversold conditions with greater clarity.
🔶 USAGE
The indicator is used similarly to a standard Stochastic oscillator but with significantly reduced noise and more stable transitions. It helps traders identify momentum and overbought/oversold conditions while maintaining a more consistent trajectory, making it easier to interpret the underlying market trend without being shaken out by minor price jitters.
🔹 Forced Persistence
Traditional oscillators achieve smoothness by applying lagging filters (like moving averages) to a fixed-length calculation. The Inertial Stochastic introduces the concept of "Forced Persistence," where smoothing is achieved by selecting the input data dynamically. By selecting the lookback length that results in the smallest change from the previous bar, the oscillator "forces" itself to remain stable. This allows the indicator to stay at extreme levels during strong trends or transition smoothly during reversals without the typical noise found in fixed-length oscillators.
🔹 Interpretation
K Line (Solid): Represents the primary smoothed inertial stochastic. It changes color based on whether it is above or below the 50 centerline (Bullish/Bearish).
D Line (Dotted): A signal line calculated as a simple moving average of the K line, used to identify potential local crossovers.
Zones: The area between the K line and the 50 level is filled with a gradient to highlight the strength and direction of the current momentum.
🔶 DETAILS
The core logic of the script is an optimization loop that runs on every bar. Instead of using one fixed value for N (the lookback period), the algorithm evaluates every possible integer length within the user-defined range (from Minimum Length to Maximum Length).
For each potential length, the script calculates a raw Stochastic value. It then measures the absolute difference between that candidate value and the final output from the previous bar. The algorithm "hunts" for the specific length that minimizes this difference:
Best Stoch = min(|Current Candidate(N) - Previous Final Stoch|)
By selecting the value that is most similar to the previous one, the indicator effectively filters out market noise by choosing a lookback window that "agrees" with the current trend's inertia. This methodology allows the oscillator to be responsive to major price shifts while ignoring minor fluctuations that do not significantly alter the lookback's internal range.
🔶 SETTINGS
🔹 Settings
Minimum Length: The shortest lookback period the algorithm can consider for the optimization loop.
Maximum Length: The longest lookback period the algorithm can consider. A wider range between min/max allows for more "inertia" but increases computational intensity.
K Smoothing: The length of the SMA used to provide a final aesthetic smoothing to the inertial stochastic value.
D Smoothing: The length of the SMA used to create the signal (D) line from the K line.
🔹 Visuals
Bullish Color: Defines the color of the K line and the upper gradient fill when the value is above 50.
Bearish Color: Defines the color of the K line and the lower gradient fill when the value is below 50.
Indicatore

Stochastic Divergence (live) AAWhat it does:
This script detects live regular bullish and bearish divergence between price and a smoothed Stochastic D line. It uses confirmed fractal swing highs and lows on price to define the first anchor point of the divergence, and those pivot settings can be adjusted in the UI. The first pivot is confirmed, but the second pivot is live, so the script can identify divergence as it is forming rather than waiting for a second confirmed swing.
A bullish divergence is found when price makes a lower low while the Stochastic D makes a higher low. A bearish divergence is found when price makes a higher high while the Stochastic D makes a lower high.
The oscillator used here is a double-smoothed Stochastic D built from TradingView’s built-in stochastic calculation. Instead of using the close as the source, it uses ohlc4, which helps reduce some of the wick-driven noise that can make divergence readings less consistent. If you want to compare or debug the signals against TradingView’s built-in Stochastic, make sure to change its source from close to ohlc4 so the readings line up properly.
This script uses a double invalidation model. A divergence setup is cleared not only when the Stochastic D loses its side of the 50 line, but also when price breaks the structure of the latest anchor pivot bar in the opposite direction. That combination helps reset the setup faster, keeps stale divergence from lingering, and makes the active signals more structurally relevant.
How to use:
Use this script as a price-action context tool, not as a blind entry or exit trigger. Bullish divergences tend to matter most when they appear after an extended move down and line up with support, liquidity sweeps, equal lows, demand zones, or other signs of downside exhaustion. Bearish divergences tend to matter most when they appear after an extended move up and line up with resistance, equal highs, trapped breakouts, supply zones, or other signs of upside exhaustion. The Pivot Left and Pivot Right settings control how strict the first anchor pivot is, with higher values giving fewer but more confirmed structures and lower values making the script more reactive. The Min and Max Bar Distance settings control how far apart the anchor point and the live opposing price extreme can be, which helps filter out weak or overly stretched divergence structures. It works best when combined with structure, location, and real price behavior around an important level, rather than used in isolation.
These are my own takes on widely used market calculations and are not meant to be a standalone trading system. If you found this useful, leave a like 🚀 and follow for more.
Thanks, and good luck on your trading journey. Indicatore

Oscillators with DivergencesIf you do enjoy this indicator, check out my Ultimate Indicator! It is another collection of indicators all into one but that is for price chart indicators like Donchian, Keltner, EMAs, VWAP, Super Trend, etc.
This is a culmination of hundreds of hours (maybe even a thousand, honestly) of work spent working with dozens of indicators and now taking all of the ones I like the most and combining them into one so you can easily switch between them. On top of that, I have my own custom divergence code that can look back up to five pivots!
There's the following indicators all wrapped into this one:
MACD
RSI
CCI
Volume-Weighted MACD
MFI
Stochastic
Stochastic RSI
I could not get a working method of looking back several pivots from other people's code so I took a 1-pivot lookback method and copied out several times and made necessary changes to work properly. It will also draw an "early divergence" the moment it's happening rather than waiting the normal 5 candles to show. Once the 5 candles have passed, it will pick the furthest back divergence as the one to stay.
Let's say you have the divergences set to 3 pivot points. If a divergence happens that goes back 1 pivot point, but later a 3 pivot divergence overlaps it, the 1 pivot will get removed after the 3 pivot early divergence is confirmed after its 5 candles have passed. Just put it on the chart and you'll see, it sounds crazy to explain.
I've added a bunch of tooltips to explain each setting. Please read them if you have questions. I've also added notes into my code if you do choose to use it for your own purposes or make changes. I wish you luck haha, it's a bit of a mess. Some things were commented out but elft in there just beacuse I never know when I want to re-enable it or just see what the original code was. Indicatore

Stochastic Alignment TrendStochastic Alignment Trend
The Stochastic Alignment Trend is a momentum-based oscillator designed to identify high-probability trend entries by monitoring the synchronization of four different Stochastic time horizons. By looking for "Alignment"—where short, medium, and long-term momentum all move in the same direction—traders can isolate periods of strong market conviction.
How It Works
The indicator tracks four Stochastic values with distinct parameters:
Short-Term: (9, 3) - Red Line
Medium-Short: (14, 3) - Pink Line
Medium-Long: (40, 4) - Green Line
Long-Term: (60, 10) - Blue Line
The script calculates the Stochastic Average of these four values (thick center line) and monitors the directional slope of every component simultaneously.
Key Features
Directional Alignment: A signal is generated (and highlighted in the background) only when all four Stochastic lines and their average are moving in the same direction.
Smart Filtering: Bullish/Bearish triangles appear when alignment starts, but are automatically filtered out if the Average Stochastic is in extreme zones (Above 80 or Below 20) to prevent entering late into exhausted trends.
Extreme Zone Highlighting: When all four Stochastics enter an extreme state (simultaneously above 80 or below 20), the background changes to a darker vivid color, signaling a potential reversal or deep over-extension.
Momentum Fill: A vertical gradient fill from the 50-level tracks the current momentum of the average line, changing color based on direction.
Visual Guide
Thick Line (Average): Green when moving up, Red when moving down.
Background Light Green/Red: All 4 Stochastics are aligned in direction.
Background Dark Green/Red: All 4 Stochastics are in the Oversold (<20) or Overbought (>80) zones.
Triangles: New momentum alignment within the "Healthy" trading range (20-80).
Settings
Stochastic Inputs: Customize the length and smoothing for each of the four engines.
Global K Smoothing: Adjust the internal %K smoothing applied before %D calculation.
Thresholds: Modify the 80/20 levels to suit different market volatilities.
Suggested Tags
Stochastic Momentum Multi-Timeframe Trend Oscillator Indicatore

Indicatore

Harmonic Periodicity Matrix [Pineify]Harmonic Periodicity Matrix — Multi-Cycle Stochastic Oscillator with Momentum Ribbon & Adaptive Signals
The Harmonic Periodicity Matrix is an advanced cycle-detection oscillator that identifies market rhythm, momentum shifts, and high-probability reversal zones by harmonically combining three stochastic waves at different periodicities. Rather than relying on a single fixed lookback window — which inevitably misses cycles of differing durations — this indicator synthesizes a short-cycle , a primary-cycle , and a long-cycle stochastic into a single composite wave. The result is a smoother, more robust picture of where the market currently sits within its natural oscillation pattern.
Key Features
Three harmonically spaced stochastic cycles fused into one composite wave
Weighted Moving Average (WMA) smoothing to reduce noise without excessive lag
EMA-based signal line that generates precise momentum-crossover triggers
Dynamic gradient coloring that visually encodes cycle strength and direction
Momentum Ribbon fill between the cycle wave and signal line for at-a-glance bias confirmation
Overbought / Oversold reference zones with subtle background shading
Filtered Buy and Sell signals that fire only when reversals originate from extreme cycle territory
How It Works
At its core, the indicator computes three stochastic oscillators (%K) across three harmonically related lengths derived from a user-defined Primary Cycle Length :
Short cycle — half the primary length ( cycleLen / 2 ), capturing fast intraday or shorter-term oscillations.
Primary cycle — the user-defined length ( cycleLen ), representing the dominant market rhythm.
Long cycle — 1.5× the primary length ( cycleLen × 1.5 ), anchoring the broader trend context.
These three stochastic readings are averaged into a single composite cycle and then smoothed with a Weighted Moving Average (WMA) over the user-defined Smoothing Factor . Subtracting 50 centers the result around zero (range: −50 to +50), making overbought and oversold conditions immediately intuitive.
A Signal Line — an EMA calculated over twice the smoothing period — acts as a lagging reference. Crossovers between the composite wave and the signal line mark momentum inflection points.
Trading Ideas and Insights
Zero-line crosses — When the composite wave crosses above 0, market momentum is transitioning bullish; below 0 signals bearish transition.
Overbought / Oversold extremes — Readings above +25 indicate potential exhaustion; readings below −25 indicate potential recovery opportunity.
Signal crossovers from extremes — The highest-conviction signals occur when the wave crosses the signal line while already in oversold (< −15, Buy) or overbought (> +15, Sell) territory.
Momentum Ribbon color — A green ribbon confirms bullish momentum continuation; a red ribbon warns of bearish pressure even if price is still rising.
How Multiple Indicators Work Together
The power of the Harmonic Periodicity Matrix comes from the deliberate combination of three stochastic oscillators and two moving average types:
The three stochastics represent different frequency bands of market activity — fast, medium, and slow. Averaging them suppresses random noise that would appear in any single stochastic while preserving genuine cyclical structure that repeats across all three timeframes simultaneously.
The WMA smoothing is applied to the averaged cycle rather than to each individual stochastic. WMA front-weights recent data, keeping the smoothed line more responsive than a Simple Moving Average while avoiding the excessive lag of longer EMAs — the ideal balance for a cycle oscillator.
The EMA signal line is computed over a longer period (2× the smoothing factor), intentionally lagging behind the main wave. This lag creates meaningful crossover events: when the faster composite wave crosses the slower signal line, it indicates a genuine shift in momentum rather than a transient fluctuation.
The gradient coloring system encodes amplitude into color, providing an instant visual read of cycle intensity that raw numbers cannot convey. The background zone shading reinforces awareness of extreme readings without cluttering the visual space.
Together, these components form a self-contained cycle analysis system: the three stochastics define the oscillation, the WMA refines it, the EMA signal line contextualizes momentum, and the visual layer communicates everything instantly.
Unique Aspects
Harmonic period spacing — Using 0.5×, 1×, and 1.5× ratios is inspired by harmonic analysis principles, where related frequencies reinforce true cyclical signals and cancel spurious noise.
Amplitude-coded gradient — Color intensity scales with distance from zero (0→40 bullish, −40→0 bearish), making it easy to distinguish a mild rebound from a powerful trend.
Filtered signals — Buy signals require the crossover to occur below −15; Sell signals require it above +15. This prevents signal generation in neutral mid-range territory where momentum reversals are statistically less reliable.
Zero-centered display — Centering around 0 (rather than displaying 0–100) aligns naturally with how traders think about bullish vs. bearish bias.
How to Use
Add the indicator to any chart and timeframe. It plots in a separate panel below the price chart.
Watch for green circles (Buy signals) — these appear when the cycle wave crosses up through the signal line from oversold territory (below −15).
Watch for red circles (Sell signals) — these appear when the cycle wave crosses down through the signal line from overbought territory (above +15).
Use the Momentum Ribbon fill color to confirm trend direction before entering trades.
Pay attention to the overbought (+25) and oversold (−25) zones — readings beyond these thresholds suggest cycle exhaustion and potential reversal.
Combine with price action or volume analysis for additional confirmation before executing trades.
Customization
Primary Cycle Length (default: 20) — Increase for longer-term swing cycle detection; decrease for faster, shorter-term cycle tracking.
Smoothing Factor (default: 6) — Higher values produce a smoother wave with more lag; lower values are more reactive but noisier.
Bullish Wave color — Default green (#089981); customizable.
Bearish Wave color — Default red (#F23645); customizable.
Equilibrium color — Default gray (#787b86); customizable.
Conclusion
The Harmonic Periodicity Matrix offers a methodologically grounded approach to market cycle analysis by combining multi-frequency stochastic decomposition, adaptive smoothing, and momentum-crossover detection into a single, visually intuitive oscillator. It is designed for traders who want more than a standard stochastic — those who seek to understand the rhythm of the market across multiple cycle lengths simultaneously. Whether you are swing trading, trend following, or timing entries within a larger move, this indicator provides a structured, repeatable framework for identifying when momentum is genuinely shifting versus when the market is simply oscillating in neutral territory. Indicatore

Delta IndicatorThis indicator provides a clear visual signal for market momentum and strength by measuring the "delta" (or difference) between a primary momentum oscillator and its moving average or signal line. You can choose between three powerful modes: RSI Delta, MACD Delta, and Stochastic Delta.
The output is a simple histogram that helps you quickly gauge the current state of momentum.
How to Interpret the Signals
The indicator's value fluctuates above and below a central zero line.
Positive Histogram (Above Zero): This signals building momentum. It means the primary oscillator (e.g., RSI, MACD line, or %K line) is stronger than its counterpart. The higher the histogram bars, the stronger the upward momentum.
Negative Histogram (Below Zero): This signals fading momentum. It means the primary oscillator is weaker than its counterpart. The lower the histogram bars, the stronger the downward momentum.
Zero Line Crossover: This is a key event. A cross from negative to positive suggests a potential shift to bullish momentum, while a cross from positive to negative indicates a potential shift to bearish momentum.
Indicator Modes
RSI Delta: Measures the acceleration of price strength. This mode is sensitive and effective for identifying short-term shifts in momentum and seeing when overbought/oversold conditions are strengthening or weakening.
MACD Delta (Standard MACD Histogram): Measures the momentum of the trend itself by showing the difference between the fast MACD line and the slow Signal line. This mode is excellent for confirming trend direction and identifying potential trend reversals.
Stochastic Delta: Measures the difference between the faster %K line and the slower %D line. This mode is highly responsive to short-term price changes and is particularly useful for identifying potential turning points in ranging markets or within a larger trend.
By using the Delta Indicator, traders can more easily spot exhaustion in a trend, confirm the strength of a new move, and identify divergences between momentum and price across different types of oscillators. Indicatore

Indicatore

Stochastic Adaptive %D [LuxAlgo]The Stochastic Adaptive %D Difference Oscillator indicator provides a sophisticated alternative to classic momentum oscillators, prioritizing a balance between high-grade smoothing and adaptive reactivity. By calculating the divergence between a pre-smoothed Stochastic %D and a specialized Adaptive %D signal line, this tool highlights momentum shifts with significantly reduced noise while maintaining the ability to react quickly to trend accelerations.
🔶 USAGE
This indicator is designed for traders who require the clarity of a smooth oscillator without the lag typically associated with heavy filtering. The "Difference Oscillator" component serves as the primary visual guide, representing the spread between momentum and its adaptive average.
🔹 Signal Generation
The indicator features three main visual components:
Standard %D Line: A dual-smoothed stochastic calculation that acts as the core momentum measure, plotted as a dotted line.
Adaptive %D Line: A reactive signal line that adjusts its smoothing alpha based on market intensity, plotted as a dashed line.
Difference Oscillator: A histogram-style fill centered at the 50 midline. This represents the momentum "delta"—when price velocity accelerates away from the adaptive baseline, the oscillator expands, providing earlier warning of trend strength or exhaustion.
When the Standard %D leads the Adaptive %D, the oscillator fills green, suggesting bullish momentum. When it lags, it fills red, suggesting bearish momentum. The expansion and contraction of this fill help identify whether a trend is gaining or losing "torque" relative to its adaptive mean.
🔶 DETAILS
The script achieves its unique balance through a specialized architectural approach that focuses on conserving smoothness while remaining reactive to volatile shifts.
🔹 Smoothness Conservation
To eliminate the "jaggedness" often found in standard Stochastics, the indicator applies a pre-smoothing filter (SMA) to the High, Low, and Close sources. This ensures that the foundation of the calculation is filtered for noise before the Stochastic formula is even applied, resulting in much cleaner oscillations.
🔹 Adaptive Reactivity
The Adaptive %D signal line employs a variable alpha smoothing mechanism. The "speed" of the signal line is dynamically linked to the position of the %D relative to the 50 midline.
Trend Extremes: As momentum reaches overbought (80) or oversold (20) zones, the alpha increases. This allows the signal line to track the %D more aggressively, capturing the peak of the move.
Mean Reversion/Ranging: Near the 50 midline, the alpha decreases, making the signal line more "stubborn" and less prone to whipsaws during low-conviction market phases.
🔶 SETTINGS
🔹 Stochastic Settings
Stochastic Length: The lookback period used for the raw stochastic range calculation.
%K Smoothing: Determines the internal smoothing applied to produce the standard %D line.
Price Pre-Smoothing: The length of the SMA applied to price sources before the oscillator is calculated to ensure foundational smoothness.
🔹 Adaptive Smoothing Settings
Attenuation Factor: A sensitivity multiplier that controls the reactivity of the Adaptive %D. Higher values increase the "inertia" of the adaptive calculation, making the signal line more conservative.
🔹 Colors
Standard %D Color: Sets the color for the core momentum dotted line.
Adaptive %D Color: Sets the color for the reactive signal dashed line.
Bullish/Bearish Color: Defines the colors used for the Difference Oscillator's gradient fill.
Indicatore

Stochastic Momentum Index - SMI | TR🎯 Overview
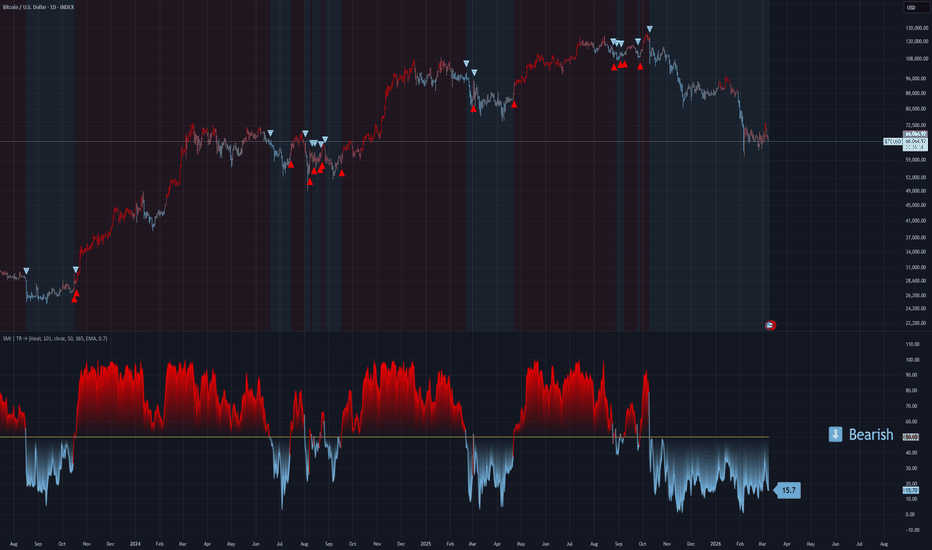
Stochastic Momentum Index - SMI | TR is a refined momentum oscillator that measures the position of the closing price relative to the midpoint of the recent high-low range. Developed by Tiagorocha1989, this enhanced version of William Blau's Stochastic Momentum Index offers dual-mode operation with moving average customization and comprehensive visual features, helping traders identify momentum shifts, overbought and oversold conditions, and potential reversal points with greater precision than traditional stochastic oscillators.
🔧 How It Works
The Stochastic Momentum Index (SMI) is an evolution of the traditional stochastic oscillator. While standard stochastic measures where price closes within the recent high-low range, the SMI measures where price closes relative to the midpoint of that range, providing a more balanced view of momentum.
Core Calculation Logic:
The indicator calculates the SMI using the standard stochastic formula:
Stochastic = (Current Close - Lowest Low) / (Highest High - Lowest Low) × 100
Where the highest high and lowest low are determined over the specified Length SMI period
The resulting oscillator oscillates between 0 and 100, with:
Readings above 50 indicating price is closing in the upper half of the recent range (bullish momentum)
Readings below 50 indicating price is closing in the lower half of the recent range (bearish momentum)
Readings above 80 suggesting overbought conditions
Readings below 20 suggesting oversold conditions
The indicator compares SMI to a reference line that can be either:
The traditional 50 level (centerline)
A user-defined moving average of the SMI itself (SMI MA mode)
✨ Key Features
🔹 Dual Operating Modes
50 Level Mode: Classic SMI implementation where signals occur when the SMI crosses above or below the 50 centerline, indicating momentum shifts
SMI MA Mode: Enhanced version where signals occur when SMI crosses its own moving average, providing smoother, filtered entries
🔹 Flexible Moving Average Selection
Choose from six MA types for the SMI MA mode:
EMA (Exponential Moving Average) for responsive signals
SMA (Simple Moving Average) for smoother readings
RMA (Rolling Moving Average) for weighted recent data
WMA (Weighted Moving Average) for customizable weighting
VWMA (Volume-Weighted Moving Average) incorporating volume
HMA (Hull Moving Average) for reduced lag
🔹 Customizable SMI Parameters
Length SMI: Lookback period for SMI calculation (default 101)
Source SMI: Price source for calculations (default Close)
🔹 Extended Lookback Period
The default length of 101 makes this version particularly suitable for longer-term trend identification and filtering out short-term market noise.
🔹 Customizable Color Themes
Eight distinct color schemes to match your charting preferences:
Classic – Green for bullish, Red for bearish
Modern – White for bullish, Purple for bearish
Robust – Amber for bullish, Maroon for bearish
Accented – Violet for bullish, Pink for bearish
Monochrome – Light gray for bullish, Dark gray for bearish
Moderate – Green for bullish, Red for bearish
Aqua – Blue for bullish, Orange for bearish
Cosmic – Pink for bullish, Purple for bearish
🔹 Comprehensive Visual Feedback
Colored SMI Line: Changes color based on position relative to the reference line
Signal Line: Yellow line showing 50 or MA reference
Gradient Fill Zones: Clear visualization of overbought (above 80) and oversold (below 20) conditions
Dynamic Zone Fills: Semi-transparent fills showing when SMI is above or below the reference line
Color-Coded Candles: Bars reflect current SMI bias (above or below reference)
Signal Markers: Triangle up/down symbols at crossover points
Live Value Display: Current SMI value shown in a floating label
Trend Table: Bullish/Bearish status displayed on the chart
🔹 Ready-to-Use Alerts
Built-in alert conditions trigger LONG signals on bullish crossovers and SHORT signals on bearish crossunders across both operating modes.
⚙️ Settings Summary
Color Choice: Select from eight visual themes (Default: Classic)
Length SMI: Lookback period for SMI calculation (Default: 101)
Source SMI: Price source for calculations (Default: Close)
Entry/Exit Signal: Choose between 50 level or SMI MA mode (Default: 50)
Length MA: Moving average period for SMI MA mode (Default: 365)
SMI MA Type: Moving average method for signal line (Default: EMA)
📈 Practical Applications
🔹 Overbought/Oversold Detection
Traditional SMI usage identifies extreme conditions:
Readings above 80 suggest overbought conditions and potential reversal down
Readings below 20 suggest oversold conditions and potential reversal up
The indicator provides gradient fills in these zones for visual clarity
The long default period (101) makes these signals more significant and less frequent
🔹 Centerline Crossovers
In 50 Level mode, crossovers provide momentum signals:
Crossover above 50 → Bullish momentum strengthening
Crossunder below 50 → Bearish momentum strengthening
These signals often confirm trend direction changes
🔹 Signal Line Crossovers
In SMI MA mode, crossovers between SMI and its moving average provide filtered signals that reduce whipsaws in ranging markets while maintaining sensitivity in trends.
🔹 Divergence Trading
SMI is excellent for spotting divergences:
Bullish Divergence: Price makes lower low, SMI makes higher low → Potential upside reversal
Bearish Divergence: Price makes higher high, SMI makes lower high → Potential downside reversal
Divergences are most significant when occurring at extreme levels (above 80 or below 20)
🔹 Trend Confirmation
The position of SMI relative to 50 confirms trend direction:
SMI consistently above 50 confirms uptrend
SMI consistently below 50 confirms downtrend
The extended 101-period length ensures these signals reflect meaningful trends
🔹 Momentum Reversal Signals
Watch for SMI turning up from oversold levels or turning down from overbought levels:
Turn up from below 20 → Potential bullish reversal
Turn down from above 80 → Potential bearish reversal
🔹 Multiple Timeframe Analysis
Compare SMI readings across different timeframes:
Higher timeframe SMI confirms primary trend direction
Lower timeframe SMI identifies entry timing and short-term momentum
🎯 Ideal For
✅ Long-Term Traders seeking to identify major trend shifts with reduced noise
✅ Swing Traders wanting to capture medium to long-term momentum shifts
✅ Divergence Traders looking for reliable reversal signals
✅ Position Traders needing confirmation of trend strength and direction
✅ System Developers needing robust, smoothed momentum signals
✅ Trend Followers wanting to avoid false signals in choppy markets
📌 Key Takeaways
Extended Lookback Period: The default length of 101 makes this indicator particularly effective for filtering out short-term noise and identifying significant trend movements
Midpoint Focus: By measuring price relative to the midpoint of the range (rather than just the range extremes), SMI provides a more balanced view of momentum than traditional stochastic
Dual-Mode Flexibility: Choose between classic 50-level crossovers for traditional signals or MA-smoothed signals for filtered entries
Comprehensive Visualization: Color themes, gradient fills for overbought/oversold zones, candles, and labels provide immediate market awareness
Divergence Capability: Excellent for spotting both regular and hidden divergences that signal trend reversals or continuations
Alert-Ready: Built-in alerts for both LONG and SHORT signals across both operating modes
⚠️ Important Notes
The long default length (101) makes this SMI variant much smoother than traditional stochastic settings (typically 14). This reduces false signals but also makes the indicator slower to react to short-term price changes. The 365-day MA default in SMI MA mode is designed for longer-term trend context on daily charts. Readings above 80 and below 20 are significant but may persist during strong trends; consider combining with trend filters. Divergences are most reliable when they occur at extreme readings. Always combine with proper risk management and additional confirmation for best results.
Disclaimer: This indicator is provided for educational and informational purposes only. Past performance is not indicative of future results. Always conduct thorough testing and align with your risk management strategy before live deployment. Indicatore
Indicatore
Strategia

Stochastic Momentum Index - SMI🎯 Overview
This is a Stochastic Momentum Index (SMI) indicator that combines stochastic momentum with moving average smoothing to identify trend direction and momentum strength in financial markets. The SMI measures where the current price closes relative to the midpoint of its recent trading range, providing enhanced sensitivity to price momentum.
🧩 Core Components
1. ⚙️ Technical Foundation
📊 Primary Calculation: Uses TradingView's built-in ta.stoch() function
📈 Range-Based: Compares closing price to high-low range over specified period
🎯 Scale: Oscillates between 0-100 with 50 as neutral midpoint
2. 🎛️ Configuration Parameters
📏 SMI Length: Default 101 periods (long-term smoothing)
📊 Source Price: Customizable (default = Close)
📈 MA Length: 30-period moving average applied to SMI
🔄 MA Type: 6 options (EMA, SMA, RMA, WMA, VWMA, HMA)
🎨 Color Themes: 5 visual schemes (Classic, Modern, Robust, Accented, Monochrome)
📈 Signal Interpretation:
🟢 BULLISH: SMI > 50 (price closing in upper half of range)
🔴 BEARISH: SMI < 50 (price closing in lower half of range)
🎯 Neutral Zone: Around 50 indicates balanced momentum
👁️ Visual Features
📈 Signal Line (MA):
Yellow moving average of SMI
Smooths momentum for clearer trend identification
🎯 Reference Lines:
50-level midpoint (white dashed line)
0-100 scale boundaries
🎨 Fill Zones:
🟢 Upper Zone : Bullish momentum area
🔴 Lower Zone : Bearish momentum area
Gradient fills enhance visual clarity
📋 Dashboard Display:
Content: "⬆️ Bullish" or "⬇️ Bearish" indicator
Purpose: Quick market bias assessment
⚡ Trading Applications
📈 Primary Uses:
🎯 Trend Identification
SMI > 50 = Uptrend momentum
SMI < 50 = Downtrend momentum
📊 Momentum Strength
Values near 100 = Strong bullish momentum
Values near 0 = Strong bearish momentum
Values around 50 = Neutral/consolidation
🔄 Mean Reversion
Extreme readings (near 0 or 100) may indicate overbought/oversold conditions
⏰ Timeframe Compatibility:
📅 Long-term: 101-period default suits swing/position trading
📊 Medium-term: Adjust lengths for daily/weekly analysis
⚡ Short-term: Reduce periods for intraday trading
🎨 Customization Options
🔄 Moving Average Types:
📉 EMA: Exponential - responsive to recent changes
📊 SMA: Simple - equal weight to all periods
📈 RMA: Relative - TradingView's special moving average
⚖️ WMA: Weighted - emphasizes recent data
💎 VWMA: Volume-weighted - incorporates volume
🚀 HMA: Hull - reduces lag significantly
🎨 Visual Themes:
🎨 Classic: Green/Red (traditional trading colors)
🚀 Modern: Cyan/Purple (modern aesthetic)
💪 Robust: Amber/Deep Purple (high contrast)
🌈 Accented: Purple/Magenta (vibrant)
⚫⚪ Monochrome: Light Gray/Dark Gray (minimalist)
🔔 Alert System
🟢 LONG Alert: Triggers when SMI crosses above 50
🔴 SHORT Alert: Triggers when SMI crosses below 50
📧 Format: Includes ticker symbol for easy identification
⚡ Key Advantages
✅ Strengths:
🎯 Clear Signals: Simple >50/<50 threshold for easy interpretation
📊 Range-Bound: Always oscillates 0-100 (no divergence issues)
👁️ Visual Clarity: Color-coded zones make analysis intuitive
🔄 Customizable: Multiple MA types and visual themes
📱 Professional: Clean, organized display suitable for all traders Indicatore