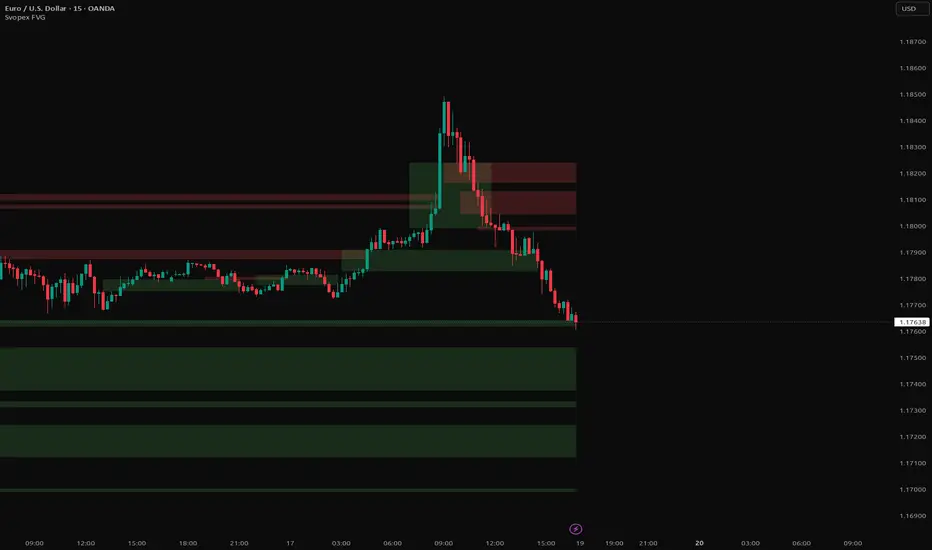
Svopex FVGSvopex FVG — multi-timeframe Fair Value Gaps with flexible mitigation
Detects and plots Fair Value Gaps (3-candle price imbalances) from any timeframe you choose, with full control over when a gap is considered "closed". Built on
@twingall's original FVG indicator (MPL 2.0), extended for higher-timeframe detection and more granular fill logic.
How FVGs are detected
A bullish (Up) FVG forms when high < low — i.e. candle −3's high is below candle −1's low, leaving an unfilled gap between them. A bearish (Down) FVG is the
mirror case: low > high . Detection happens on the Zone timeframe you pick, not the chart timeframe, so you can view HTF gaps while trading a lower timeframe.
Detection is non-repainting — only closed HTF candles are used (via request.security with lookahead_off and a 1-bar shift).
Zone timeframe
Two ways to control which timeframe drives detection. Either set the Zone timeframe explicitly (default 1H), or flip the "Use chart timeframe" toggle — when on, the
indicator automatically follows the chart's current timeframe, so switching your chart from 1H to 15M also switches the displayed FVGs. The Zone timeframe input is
ignored while the toggle is on, but stays available as a fallback.
Fill threshold
Controls when a gap stops extending to the right. A single slider (0–100%) replaces the older "Use CE vs Full Fill" toggle. Set it to 100 and the FVG remains active
until price fully closes the gap. Set it to 50 and it closes at the midline (equivalent to a CE / Consequent Encroachment touch). Set it to 0 and any penetration of
the gap's near edge counts as a hit. Any value in between works — e.g. 70 means the FVG ends when price has filled 70% of its height.
Include wick
Decides what price data drives the fill check. When off (default, body-only), the gap only closes if the candle's body (max/min of open/close) crosses the threshold —
intrabar wicks are ignored. When on, wicks count too (strict mode): a long shadow through the gap is enough to close it.
Visuals
Up FVGs render in green, Down FVGs in red, both at 80% transparency by default — matching the Svopex Supply & Demand Zones indicator for visual consistency if you use
both. Colors are user-configurable. Optional "delete filled boxes" fully hides mitigated gaps instead of just freezing them. A lookback (in days) controls how far back
fresh FVGs are allowed to be drawn.
Alerts
Six alert conditions are exposed. "ABOVE/BELOW threshold" fires when price crosses the fill threshold of the latest active FVG in each direction — useful for CE
rejections or full-fill confirmations. "IOFED into latest active Up/Down FVG" fires when price first enters the gap at its near edge, regardless of the fill threshold
setting. "Simple alert: Up/Down FVG (confirmed)" fires the moment a fresh FVG forms on the chosen HTF.
Settings summary
Lookback in days, Use chart timeframe toggle, Zone timeframe (default 60), Up/Down FVG visibility and colors, Delete filled boxes, Fill threshold percent (default 50),
Include wick.
Based on the original FVG indicator by @twingall (MPL 2.0). Extensions by Petr Svoboda: removed legacy CE display, replaced the CE-vs-Full-Fill toggle with a
continuous fill percent, added HTF detection via request.security, added the chart-TF auto-follow toggle, aligned default colors with Svopex Supply & Demand Zones.
Indicatore

Indicatore
Svopex Supply & Demand ZonesAutomatically detects and plots Supply and Demand zones using 4H price action — works on any chart timeframe.
This indicator draws the classic Supply & Demand zones that institutional traders watch: areas
where price consolidated (a "base") and then exploded away sharply. These zones often act as
powerful support/resistance when price returns.
- Supply zones (red) — where price consolidated, then dropped sharply → expect selling
pressure on retest.
- Demand zones (green) — where price consolidated, then rallied sharply → expect buying
pressure on retest.
- Zones extend to the right and automatically freeze the moment price closes through them, so
your chart stays clean.
- Detection always runs on the 4H timeframe (configurable), regardless of the chart you're
viewing — so zones stay consistent whether you're on 15m, 1H, 4H or Daily.
How it works
A zone is formed by the textbook 4-candle patterns:
- DBR (Drop → Base → Rally) → Demand zone
- RBR (Rally → Base → Rally) → Demand zone
- RBD (Rally → Base → Drop) → Supply zone
- DBD (Drop → Base → Drop) → Supply zone
Detection logic:
1. Base candle = body smaller than Base body ≤ ATR × (default 0.5 × ATR).
2. Explosive candle = body larger than Explosive body ≥ ATR × (default 1.5 × ATR).
3. When 1–3 base candles are followed by an explosive candle, the base range becomes a zone.
4. The zone is drawn from the base's start time, with top = highest base high and bottom =
lowest base low.
5. Zones are non-repainting — detection uses the previous confirmed HTF bar (request.security
with lookahead_off + ).
Inputs
• Zone Timeframe — default 240 (4H). Timeframe used for zone detection.
• Max base candles — default 3. Maximum base candles allowed before the explosive move.
• Base body ≤ ATR × — default 0.5. Base candle body must be smaller than this × ATR.
• Explosive body ≥ ATR × — default 1.5. Breakout candle body must be larger than this × ATR.
• ATR length — default 14. Reference volatility for base/explosive classification.
• Supply / Demand fill — default red / green @ 80% transparency. Zone colors, fully
customizable.
• Show labels — default ON. Displays "Supply" / "Demand" text labels.
• Max active zones per side — default 20. FIFO cap to keep the chart tidy.
How to use it
- Swing / day trading: Watch for price to retest a zone and look for rejection candles /
reversal signals.
- Confluence: Zones overlapping with POC, VAH/VAL, LVN, prior session high/low or
psychological levels are significantly stronger.
- Trend continuation: In an uptrend, buy retests of Demand zones; in a downtrend, sell retests
of Supply zones.
- Broken zones: Once price closes through a zone, the box is frozen — a broken Supply often
flips into Demand (and vice versa).
Tuning guide
- Too many zones? Increase Explosive body ≥ ATR × to 2.0 and/or lower Base body ≤ ATR × to
0.3.
- Not enough zones / high-volatility asset? Raise Max base candles to 5–6 and lower Explosive
body ≥ ATR × to 1.2.
- Forex / indices / futures → defaults work well.
- Crypto → try Explosive body ≥ ATR × = 2.0 for cleaner signals.
Notes
- Detection is based on candle bodies, not wicks — long-wick base candles may occasionally
produce wider zones than expected.
- Zone break is measured on close, not wick — intrabar spikes through a zone will NOT
invalidate it (by design — filters noise).
- Zones appear only after the next 4H candle confirms → non-repainting, but with one HTF-bar
delay.
Open-source. Feel free to fork, tweak, and make it your own. Feedback welcome in the comments. Indicatore

Breaker Block Engine [AGPro Series]Breaker Block Engine
Overview
Breaker Block Engine is a dedicated detection and tracking tool for one of the
most misunderstood concepts in Smart Money trading: the Breaker Block. A
breaker block is an order block that has failed and flipped role — a bearish
order block broken upward now behaves as bullish support, and a bullish order
block broken downward now behaves as bearish resistance. The engine does not
just draw them; it validates each break with displacement strength, tracks
every retest, scores how well each breaker has held its role, and surfaces the
dominant bullish and bearish breakers through a clean info panel.
Unique Edge
Most breaker block scripts stop at drawing a flipped zone. This engine goes
further:
- Each break is validated using an ATR-scaled close-based displacement filter,
optionally combined with above-average volume confirmation, to reject weak
wick-based breaks.
- Every retest of a breaker is counted and evaluated as Held or Lost, and the
state label on the chart shows a live retest hold percentage for each
breaker (for example "Bull Breaker | Held x6 (100%)").
- An invalidation buffer prevents single-wick noise from prematurely killing
otherwise healthy breakers, while genuinely violated zones fade into a gray
"Lost" state and are removed from tracking shortly after.
- Intra-side and cross-side confluence grouping automatically clean up
overlapping labels so the chart stays readable even when several breakers
cluster within half an ATR.
- The info panel summarises the whole picture in one glance: dominant side,
active counts per side, nearest breaker distance in both price and ATR
multiples, and overall retest hold percentage.
Methodology
1. Swing Detection. Confirmed pivot highs and pivot lows are identified using
a configurable pivot length. These pivots anchor the search for order
block candidates.
2. Order Block Candidate. For each confirmed pivot high, the script walks
back up to ten bars looking for the last bearish candle — this is the
bearish order block candidate. The symmetrical process identifies bullish
order block candidates around pivot lows.
3. Break Validation. A candidate is promoted to a breaker only when price
closes past the opposite edge of the order block by at least a
user-defined ATR multiple (default 0.75 × ATR). An optional volume
confirmation filter can additionally require the break candle to trade
above its volume moving average.
4. Retest & Hold Scoring. After formation, each breaker is checked every bar.
If price re-enters the zone and the close respects the breaker's intended
direction, a Hold is recorded; otherwise the retest is counted but not
held. A minimum bar spacing prevents consecutive bars of a sustained
retest from inflating the counter.
5. Invalidation. If price closes past the far edge of the breaker by more
than the invalidation buffer (in ATR), the breaker is marked Lost,
visually faded, and removed from active tracking after a short grace
period.
6. Confluence Grouping. On the most recent bar, breakers whose mid-points
sit within max(0.5 × ATR, 0.5 % of price) of each other have their
overlapping state labels resolved: dead labels yield to alive labels,
older labels yield to newer ones. A cross-side pass prevents stale
opposite-side labels from sitting on top of active ones.
Signals & Alerts
The script provides three alert events:
- New Breaker: fires on the bar a bullish or bearish breaker is confirmed.
- Retest Hold: fires when price retests an active breaker and the close
respects the zone direction.
- Invalidation: fires when an active breaker is broken in the opposite
direction beyond the invalidation buffer.
On-chart signals include the zone itself (coloured by side), a small
directional triangle at the break point, and a dynamic state label on the
right edge showing the breaker's test count and hold percentage.
Key Inputs
- Swing Pivot Length: bars on each side used to confirm swings. Higher values
produce fewer but structurally stronger swings.
- Max Active Breakers per Side: hard cap on simultaneously tracked bullish
and bearish breakers; oldest are pruned when the limit is reached.
- Displacement Strength: ATR multiple required for a close-based break to
validate. Higher values produce fewer, stronger breakers.
- Require Volume Confirmation: when enabled, the break candle must trade
above its volume moving average.
- Invalidation Buffer: ATR buffer added beyond the breaker edge before the
breaker is considered invalidated. Prevents wick-based noise kills.
- Min Bars Between Retests: minimum bar spacing between consecutive retests
of the same breaker, keeping counters from inflating on sustained visits.
- Zone Transparency, Colours, Label & Panel Sizes: full visual control.
- Panel Location, Theme, Far Zone Threshold: the info panel can be placed in
any of six positions, switched between Dark and Light theme, and the
threshold for labelling distant zones as "Far" is user-configurable.
How to Use
- On mid-to-high timeframes (15m and up), leave the defaults. The engine is
tuned for 15m to 4h out of the box but works on any timeframe and
instrument.
- Use the state label hold percentage as a quality gauge. A breaker with a
long history of holds (for example "Held x6 (100%)") has demonstrated
institutional interest at that level; a breaker with mixed results deserves
more caution.
- Use the panel to orient quickly. If the dominant side is Bullish and the
nearest bullish breaker sits within a fraction of an ATR, the chart is in
a supportive regime for long bias; if both nearest values show "Far",
price is floating between structures and caution is warranted.
- Combine with higher-timeframe context. A bullish breaker on the 1h that
aligns with a bullish breaker on the 4h is a stronger zone than either
alone.
Limitations & Transparency
- This is an indicator, not a strategy. It draws zones and tracks their
behaviour; it does not generate buy or sell orders, manage positions, or
calculate performance statistics against a price series.
- Pivot-based detection is inherently lagging by the pivot length: a swing
is only confirmed once the configured number of bars have printed past it.
- Results depend on input choices. Different displacement multipliers, pivot
lengths, and retest gaps will produce different breaker sets. The defaults
are a starting point, not a recommendation.
- No indicator can guarantee future behaviour. A breaker that has held ten
times in the past can fail the next time it is tested.
Risk Disclosure
This script is provided for educational and research purposes only. It is not
financial advice and does not constitute a recommendation to buy, sell, or
hold any instrument. Trading carries substantial risk of loss. Users are
solely responsible for their own trading decisions and risk management. Past
behaviour of a breaker, or of any zone shown by this script, does not
guarantee future results. Indicatore

Camarilla Levels Intraday @darshaksscCamarilla Pivot Levels are one of the most reliable intraday support and resistance frameworks used by professional traders worldwide. Unlike traditional pivots, Camarilla levels are derived from the previous day's range and close, giving highly precise price zones for reversals, breakouts, and targets — all calculated before the market opens.
𝗛𝗼𝘄 𝗶𝘁 𝘄𝗼𝗿𝗸𝘀:
This indicator uses the confirmed previous day's High, Low, and Close to calculate eight Camarilla levels (H3 to H6 and L3 to L6) plus Previous Day High, Low, and Close reference lines. Levels are fixed for the entire trading session and update only at the start of each new day.
𝗞𝗲𝘆 𝗟𝗲𝘃𝗲𝗹𝘀 𝗘𝘅𝗽𝗹𝗮𝗶𝗻𝗲𝗱:
- H3 — Sell Reversal zone. Price often rejects here in a downtrend
- H4 — Breakout level. A close above H4 signals strong bullish momentum
- H5 / H6 — Breakout targets 1 and 2 for extended upside moves
- L3 — Buy Reversal zone. Price often bounces here in an uptrend
- L4 — Breakdown level. A close below L4 signals strong bearish momentum
- L5 / L6 — Breakdown targets 1 and 2 for extended downside moves
- PDH / PDL / PDC — Previous Day High, Low, and Close for context
𝗙𝗲𝗮𝘁𝘂𝗿𝗲𝘀:
- Non-repainting — all levels based on confirmed previous day data
- Same values on all timeframes (5m, 15m, 1H, Daily — identical levels)
- Timeframe-aware line length — adapts automatically to your chart timeframe
- Clean dashboard showing all levels and current LTP at a glance
- Fully customisable colors for buy, sell, and target zones
- Toggle each level group independently (Reversal, Breakout, Targets, PDH/PDL/PDC)
- 4 built-in alert conditions for Breakout, Breakdown, and Reversal zones
- Coded in Pine Script v6
𝗛𝗼𝘄 𝘁𝗼 𝘁𝗿𝗮𝗱𝗲 𝘄𝗶𝘁𝗵 𝗶𝘁:
Reversal trades: Look for rejection candles at H3 (short) or L3 (long) with confirmation
Breakout trades: Wait for a candle close above H4 (long) or below L4 (short), then target H5/H6 or L5/L6
Reference: Use PDH and PDL as additional confluence zones
𝗧𝗶𝗺𝗲𝗳𝗿𝗮𝗺𝗲𝘀: Best on 5m / 15m / 1H for intraday. Works on all timeframes.
𝗜𝗻𝘀𝘁𝗿𝘂𝗺𝗲𝗻𝘁𝘀: Indices, Stocks, Futures, Forex, Crypto
⚠ This indicator is for educational and analytical purposes only.
It does not constitute financial advice. Always apply your own risk management.
by @darshakssc Indicatore

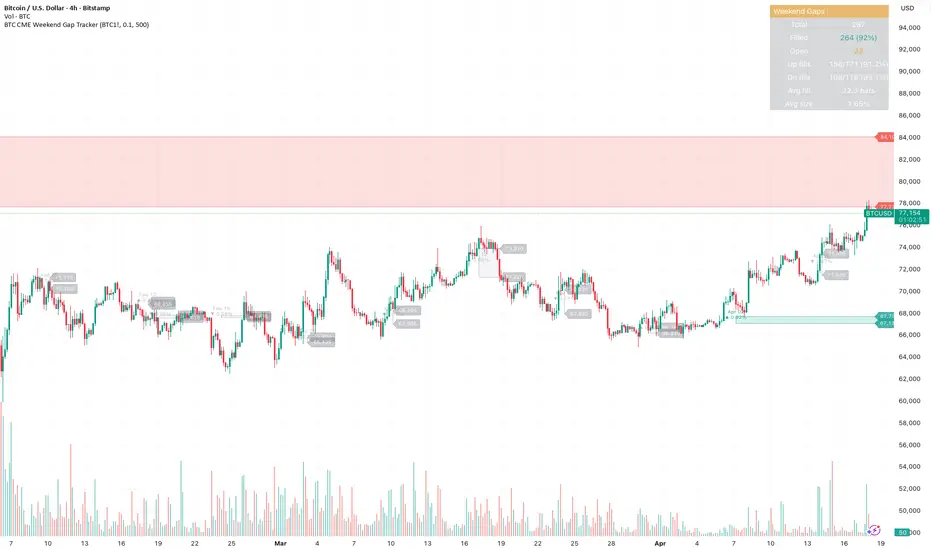
BTC CME Weekend Gap TrackerBTC CME Weekend Gap Tracker
Automatically detects and tracks weekend gaps on CME Bitcoin futures (BTC1!). When CME closes Friday evening and reopens Sunday/Monday, any price movement in spot during that window creates a gap — this indicator marks those gaps directly on your chart.
What it shows
Red boxes — weekend gap down (CME reopened lower than Friday close)
Green boxes — weekend gap up (CME reopened higher than Friday close)
Gray boxes — filled gaps (price has since traded back through the range)
Key features
Weekend-only filter — ignores daily maintenance gaps, only tracks the meaningful Friday-to-Monday gaps (and extended holiday closures)
Price levels labeled at the right edge of each unfilled gap so you can see exact gap boundaries at a glance
Date and percentage size shown inside each box
Unfilled gaps extend right until filled, then fade to gray
Stats table tracking total gaps, fill rate, gap-up vs gap-down fill rates, average fill time, and average gap size
How to use
Apply to any BTC chart (BTCUSD, BTCUSDT, BTCUSDT.P) on daily or intraday timeframes. The script pulls CME data automatically. Use unfilled gaps as potential price targets — historically, the majority of CME gaps fill over time, though large gaps in strong trends can remain open for extended periods.
Settings
Minimum gap size threshold (filter noise)
Max bars to track (history depth)
Toggle price levels, percentages, and dates independently
Customize gap colors
Alerts
Two alert conditions included: new weekend gap up and new weekend gap down. Set these up to get notified when CME reopens Monday with a gap.
Indicatore

Indicatore

Indicatore

Nilesh MTF Liquidity LevelsOverview
This indicator plots multi‑timeframe liquidity levels (highs and lows) on the chart and removes them once price sweeps the level. It is designed to help traders see where liquidity may be resting above or below current price.
How it works
The script tracks the previous candle’s high and low on several higher timeframes (15m, 30m, 1H, 4H, Daily) and draws horizontal lines from those levels into the future. When price makes a wick or close beyond a level (depending on the user setting), that level is considered swept and its line is removed from the chart.
Inputs & customization
Toggle each timeframe: Show 15m, 30m, 1H, 4H, Daily
Max levels per timeframe to control how many lines stay on the chart
Separate line width settings for each timeframe
Individual colors for each timeframe
Optional “Require close beyond level” to use candle close instead of wick for sweeps
Usage notes
These levels are not signals on their own. They are intended to be used together with your own price action, liquidity or S/R strategy. Always manage your risk and test on replay or demo before using in live trading.
Indicatore

Indicatore

Indicatore
Indicatore

Macro Fibo LookBackAuto Macro Fibonacci (
Overview
Drawing Fibonacci retracements manually on higher timeframes can often be subjective and tedious. The Auto Macro Fibonacci indicator automates this process by scanning a user-defined historical period (lookback) to identify the absolute macro peak and trough, instantly plotting a flawless, rule-based Fibonacci retracement.
Whether you are looking for deep pullbacks, harmonic pattern completion zones, or major structural support/resistance, this tool filters out the intraday noise and focuses on the big picture.
Key Features
Smart Lookback Engine: Scans the last X bars (default is 300) to find the true macro high and low. You can easily expand this to 500 or 1000 bars to capture multi-year trends.
Auto Trend Detection: The algorithm mathematically calculates which pivot happened first, automatically determining if the macro trend is bullish or bearish, and aligns the 0.0 and 1.0 anchor levels correctly.
Custom Directional Control: Prefer your Fibo anchors drawn differently? Use the settings menu to override the auto-detection and force the draw from "Left to Right" or "Right to Left" to suit your personal trading style.
Includes the 0.886 Level: By default, this indicator includes the 0.886 retracement level, a critical zone for Harmonic pattern traders (specifically the Bat form) and deep liquidity grabs.
Performance Optimized: Built with a custom garbage-collection system (memory management). It dynamically deletes old historical lines on every tick, ensuring it runs lightning-fast on live markets without lagging your chart or hitting TradingView's drawing limits.
Minimalist UI: Designed to keep your charts clean. A single color setting applies to the entire Fibonacci web and the macro dashed trendline, with carefully balanced transparency levels so it doesn't distract from price action.
How to Use
Lookback Period (Bars): Adjust this number to widen or narrow the indicator's field of vision. Smaller numbers (e.g., 100) will catch intermediate swings, while larger numbers (e.g., 500+) will catch major cycle highs and lows.
Fibo Direction: Leave it on "Automatic" for algorithmic trend plotting, or manually flip the 0.0 and 1.0 levels.
Lines Color: Pick one color to seamlessly theme the entire indicator.
Disclaimer: This script is for educational and analytical purposes only. Always use proper risk management. Indicatore

Indicatore

QM Range (DAFE)Quasimodo Range Engine
A Systematic Framework for Liquidity, Structure, and Range Analysis
A Mechanical Approach to Decoding Market Microstructure and Order Flow.
🎓 THEORETICAL FOUNDATION
The Quasimodo Range Engine (QM-R) is a comprehensive analytical framework designed to map market structure by tracking the flow of liquidity. It is built on the premise that markets frequently engineer liquidity through temporary sweeps of established pivot points, trapping breakout participants before initiating a reversal that breaks local structure.
This specific sequence—a liquidity sweep followed by a structural failure—is classically known as the Quasimodo (QM) pattern. However, the QM-R engine goes beyond simply identifying isolated patterns. It utilizes these patterns as the foundational building blocks to define active trading ranges, track structural shifts (BOS/CHoCH), and project fading Supply and Demand zones.
Architectural Pillars
Pillar 1: 3-Candle Fractal (3CF) Liquidity Mapping
The engine continuously scans for 3-Candle Fractals to identify strict, algorithmic swing highs and lows. It projects horizontal "Liquidity Lines" forward in time from these pivots. These lines represent resting liquidity pools. When price intersects these lines, the engine monitors the reaction to determine if it is a genuine breakout or a liquidity sweep.
Pillar 2: Mechanical Quasimodo Detection
A QM pattern is registered only when a strict sequence of events occurs within a user-defined validity window (QM Break Lookback):
The Sweep: Price must cross a previously established 3CF Liquidity Line.
The Rejection: Price must reverse, closing back within the previous structure.
The Break: Price must then impulsively break the opposing fractal pivot that originated the sweep.
When this sequence completes, the engine draws the QM zone, labels the pattern, and plots a "Trap Vector" showing the mechanics of the sweep-and-break.
Pillar 3: Automated Equilibrium Range Formation
A single QM pattern is a localized event; two opposing QM patterns define a market regime. When a Bullish QM and a Bearish QM form within a specific proximity to each other (Max QM1-QM2 Gap), the engine links them. It establishes the high and low of this sequence as an active Equilibrium Range (ERL/ERH), framing the current consolidated price action.
Pillar 4: Structural Resolution (BOS / CHoCH)
Once a range is established, the engine monitors its boundaries. A confirmed candle close outside the Equilibrium Range signifies a structural resolution.
Break of Structure (BOS): A break in the direction of the dominant macro trend.
Change of Character (CHoCH): A break opposing the established range context.
Upon resolution, the active range is dissolved, and the broken boundary leaves behind a Ghost Line —a historical memory of broken structure that often serves as future, flipped support/resistance.
Pillar 5: Reactive Supply & Demand Origination
Immediately following a BOS or CHoCH, the engine traces back a user-defined number of bars (SD Formation Lookback) to locate the origin candle of the impulsive move. It automatically draws a Supply or Demand zone from this origin. Crucially, these zones feature a degradation mechanic: they fade in opacity with each subsequent price touch, visually representing the consumption of resting orders until they are completely invalidated.
Pillar 6: Footprint Delta Integration & Trap Validation
To validate the "liquidity sweep" phase of the QM pattern, the engine integrates real order flow. If Footprint data is enabled, it analyzes the tick-level delta during the exact candle that swept the pivot.
If a Bullish QM features heavy negative delta (selling) during the downward sweep, it confirms that sellers were successfully trapped.
If Footprint data is unavailable, the engine automatically deploys a sophisticated OHLCV synthetic delta fallback to estimate the intrabar pressure.
Pillar 7: Integrated Trade Evaluation Engine
The script includes an internal statistical engine that evaluates the hypothetical performance of every detected QM pattern based on user-defined Risk/Reward parameters (SL Ticks / TP Ticks). It calculates whether historical setups achieved the minimum required R:R, feeding this data into the dashboard to provide an objective win-rate metric for the current asset and timeframe.
🔧 COMPREHENSIVE INPUT SYSTEM
🔍 Detection Engine
QM Break Lookback: The maximum allowable bars between a liquidity sweep and the subsequent structural break. Prevents identifying drawn-out, unrelated price action as a QM.
Max QM1-QM2 Gap: The maximum bar distance between opposing QM patterns to form a valid Equilibrium Range.
SD Formation Lookback: How far back the engine searches to find the origin candle for a Supply/Demand zone after a structural break.
👣 Real Orderflow (Footprint)
Enable Real Footprint Delta: Toggles the use of TradingView Premium tick-level data for precise trap validation and dashboard metrics.
Ticks per Row / Value Area %: Granularity controls for the background footprint processing.
📐 Trade Evaluation (SL/TP)
Stop Loss / Take Profit (Ticks): The parameters used by the internal statistical engine to back-test the historical success rate of detected QM patterns.
Min R:R Ratio: The threshold required for the dashboard to classify a historical pattern as "Profitable."
⚡ Performance Settings
Max History Limits: Memory management controls (Max 3CF, Max QM, Max Zones) to ensure the indicator runs smoothly on deep charts without exceeding Pine Script limits.
* Zone Touch Limit: The exact number of times price can tap a Supply/Demand zone before it is permanently deleted from the chart.
🎨 Display Options
Granular toggles for every visual element: 3CF Markers, Liquidity Lines, QM Patterns, Range Boundaries, BOS/CHoCH Lines, Ghost Lines, and Fading SD Zones.
📊 ANALYTICS DASHBOARD
The script features a highly detailed, non-intrusive HUD (Heads-Up Display) that provides a real-time statistical overview of the market structure.
Macro Context (RCM Integration): Displays the current market regime (Pro-Trend, Counter-Trend, Neutral) and Structural Integrity via the imported Ricci Curvature Machine (RCM) library.
Footprint Data: Displays the live, tick-level Buy Volume, Sell Volume, Delta, Point of Control (POC), and Value Area (VAH/VAL) for the current developing bar.
QM Metrics & Range State: Tracks whether an Equilibrium Range is currently active. Displays the total count of Bullish and Bearish QMs, calculating their exact percentage weighting in the current market.
Structural Statistics: Maintains a running tally of Trapped Volume occurrences, Total Bull BOS, Total Bear CHoCH, Active SD Zones, and active Ghost Lines.
Performance Evaluation: Outputs the percentage of historical QM patterns that successfully achieved the user's defined Risk:Reward ratio, alongside the average delta recorded during those setups.
Narrative Footer: A dynamically updating text panel that translates the raw data into a readable market narrative (e.g., "Heavy directional dominance," "Order flow balanced").
🎨 VISUAL SYSTEM
The Quasimodo Range Engine is fundamentally a visual tool. Every line, box, and label drawn on the chart is a direct representation of the engine's analytical process. It is designed to tell a clear, objective story of how liquidity is being engineered and how market structure is evolving in response. Understanding these visual components is key to leveraging the engine's full analytical power.
Liquidity Mapping: 3CF Pivots & Lines
This is the foundational layer of the entire system.
3CF Markers (○): A small, colored circle marks every confirmed 3-Candle Fractal pivot. These are the raw, objective swing points that the engine identifies as potential liquidity pools.
Liquidity Lines (Dotted): A dotted horizontal line is projected forward in time from every 3CF Marker. This line represents the precise price level of untapped liquidity. The line continues to extend until price trades through it, at which point it stops, providing a clean visual confirmation that the liquidity at that level has been "swept" or "taken."
The Quasimodo Pattern: A Complete Visual Narrative
When a full QM pattern is confirmed, the engine draws a composite visual to provide a complete summary of the event.
The QM Zone (Box): A colored box highlights the entire price range of the QM pattern, from its origin pivot to the structural break. The color indicates its nature (Bullish or Bearish) and is brighter if a "trap" was detected, signaling higher conviction.
Sweep & Break Lines: Two horizontal lines provide the core narrative. The dashed line marks the liquidity level that was swept, while the solid, thicker line marks the structural level that was subsequently broken. This visually dissects the two key events of the pattern.
The Trap Vector (Arrow): A colored arrow connects the point of the liquidity sweep to the point of the structural break. This powerful visual illustrates the "trap-and-reverse" motion, graphically representing the path of the institutional move.
The QM Label: Provides critical context at a glance, identifying the pattern as "Bullish QM" or "Bearish QM" and, through its RCM integration, classifying it as "Pro-Trend," "Counter-Trend," or "Neutral."
Range Demarcation: Equilibrium Range (ERL/ERH)
When two opposing QM patterns form a valid range, the engine clearly demarcates it.
Swing Point Markers (⭕): Large, hollow circles are placed on the absolute highest high and lowest low of the price action that formed the range, marking the outer boundaries of the entire consolidation structure.
ERL/ERH Labels: "ERL" (Equilibrium Range Low/High) labels mark the specific structural break levels from the two QM patterns that define the range. These are the precise boundaries to monitor for a BOS or CHoCH.
Structural Resolution: BOS, CHoCH & Ghost Lines
This visual layer tracks the outcome of range-bound price action.
BOS/CHoCH Lines & Labels: When a range boundary is broken, a thick, solid line (green for Bullish BOS, red for Bearish CHoCH) is drawn at the broken level, accompanied by a clear label. This provides an un-missable confirmation that the market has shifted from balance to imbalance.
Ghost Lines (Faded, Dashed): After a BOS or CHoCH occurs, the broken structural line does not disappear. It remains on the chart as a faded "Ghost Line." This represents the market's memory of that broken structure, as these levels frequently act as future support/resistance flip zones.
Reactive Supply & Demand: Fading Zones
Following a structural break, the engine automatically draws the zone that originated the move.
Supply & Demand Boxes: A red box is drawn for a Supply zone (origin of a down-move) and a green box for a Demand zone (origin of an up-move).
Fading Mechanic: This is a critical visual feature. Each time price touches a zone, the box's opacity increases (it becomes more transparent). This visually represents the consumption of orders within the zone. After a user-defined number of touches (Zone Touch Limit), the zone is considered fully mitigated and is automatically removed from the chart.
The Analytics Dashboards
To keep the chart clean, the bulk of the data is presented in two distinct dashboard panels.
The Main Dashboard: Provides a comprehensive quantitative breakdown of all engine metrics, from real-time footprint data to the statistical performance of historical QM patterns.
The Trend Narrative Panel: This qualitative panel translates the complex data from the engine and its integrated RCM library into simple, human-readable sentences, providing an instant summary of the market's condition regarding Regime, Kinetics, Structure, and Order Flow.
⚖️ RESPONSIBLE USAGE & LIMITATIONS
Analysis, Not Execution: This engine is a descriptive analytical framework designed to map market structure. It is not an automated trading strategy. The drawn QM patterns are historical and structural observations, not guaranteed buy/sell signals.
Trade Evaluation is Hypothetical: The "Profitable QMs" metric displayed on the dashboard is a basic, rigid statistical evaluation based on fixed tick inputs. It does not account for slippage, commissions, spread, or dynamic trade management. It is designed to measure the general effectiveness of the pattern on a specific asset, not to simulate a live trading PnL.
Data Requirements: The Footprint functionality requires access to tick data (typically a Premium subscription). Without this, the script functions entirely normally using its built-in mathematical OHLCV synthetic delta approximation, but will lack exact tick precision for the "Trap Absorbed" metric.
🔮 CONCLUSION
The Quasimodo Range Engine brings a rigorous, mechanical approach to structural market analysis. By tracking the exact sequence of liquidity sweeps, structural breaks, and the subsequent formulation of trading ranges, it removes subjectivity from chart reading. It allows analysts to view price action as a continuous cycle of liquidity engineering, range expansion, and supply/demand mitigation, providing a deeply contextualized map of market behavior.
— Dskyz, Trade with insight. Trade with anticipation. (Don't follow the trend, be the trend) Indicatore

Daily Deviation Range and Gap Stats - NikaQuant
## What It Does
This indicator projects six pairs of deviation levels above and below a defined session range, draws a daily gap line at a configurable time, and shows a live stats panel with historical hit rates, mean-revert rates, gap fill statistics, and trade-decision suggestions.
The range itself is captured as the high and low of 5-minute closes during a configurable New York time window (default 19:30 to 20:30 NY). Once the window closes, the range is locked and six fibonacci-style deviation levels at multiples 1, 2.5, 5, 8, 13, and 19 of the range size are projected forward both upward and downward across the next trading day until a configurable cutoff (default 16:00 NY next day).
A separate gap line is captured at a configurable time (default 15:55 NY) using the close of that 5-minute bar. The gap line extends visually across the overnight session and is monitored for fill during the next session's open-to-close window (default 09:30 to 16:00 NY). When price crosses the gap level inside that window, the line is locked at the fill bar.
A live statistics table aggregates historical performance per day for the lookback period, showing per-level touch frequencies, mean-revert frequencies, close-inside-level frequencies, and gap fill statistics, then turns these into actionable trade-setup suggestions.
## Why It Is Original
Unlike a standard pivots or fibonacci-retracement indicator, this script is not a static price-level projection. It is a session-range deviation framework combined with an integrated gap tracker and a per-level historical statistics engine.
This script combines three distinct functional modules because each one addresses a different question about session structure:
(1) The range-multiple deviation levels answer "how far has price moved from session balance, in units of session range?" — analogous to standard-deviation channels but anchored to a user-defined range window rather than a rolling average.
(2) The daily gap line answers "is there an unfilled overnight reference price and what is the historical edge of trading toward it?" — different from standard gap detectors that only flag open-to-close gaps because it captures a specific price (the close at gap-time) and tracks fill behaviour inside a defined session window.
(3) The historical statistics engine answers "given today's structure, what has actually happened on past days when price reached the same levels or when a gap was open at this distance?" — turning the visual levels into probability-weighted decision inputs rather than just lines on a chart.
Together, the three modules produce something none of them would alone: a session-relative deviation map with quantified historical edge per level, plus a context-aware trade decision suggestion that combines current position, time remaining in the session, and historical revert behaviour.
The script also enforces a strict 5-minute internal data resolution regardless of chart timeframe (1-minute through 1-hour), so the levels and gap stay consistent whether the user is on a 5m chart or a 1H chart. This is accomplished via a dual-path data fetch that adapts to the chart's timeframe — pulling individual 5-minute samples on lower-timeframe charts and aggregating 5-minute closes per chart bar on higher-timeframe charts.
## How It Works
On each chart bar the script collects the 5-minute bars that have closed since the last update. For each 5-minute bar it checks whether the bar falls inside the range window, the extension window, the gap trigger time, or the gap fill window, and updates the relevant state.
When a 5-minute bar marks the end of the range window, the script locks in the highest and lowest 5-minute closes of the window, computes the range size and midline, and draws the deviation levels at multiples of the range above the high and below the low, projected forward to the configured extension-end time. A range-outline box is drawn over the range window for visual reference.
When a 5-minute bar matches the gap-trigger time, the script captures that bar's close as the gap price and starts drawing a horizontal line. On every subsequent 5-minute bar inside the next session's gap-fill window, the script checks whether the bar's high-low straddles the gap price. If so, the line is locked and the gap is recorded as filled.
Every time a deviation level is touched intraday — the 5-minute high reaches an upper level or the 5-minute low reaches a lower level — the script records that touch for the day. If price subsequently revisits the midline before the extension window ends, all touched levels for that day are also recorded as having reverted. When the extension window ends, the day's data is appended to a rolling history.
Each day's gap statistics (occurred, filled, minutes from fill-window open to fill) are appended at the next gap trigger, which ensures the gap is paired with its complete fill outcome before the next gap overwrites the live tracking state.
The stats table reads the history and renders per-level touch frequency, per-level revert frequency, close-inside-level frequency, gap fill rate, gap fill-time distribution (average, median, percent filled within 1 hour, percent filled within 4 hours), daily directional bias, range expansion vs contraction regime, day-type classification, time-elapsed in the active extension, and a context-aware trade-setup suggestion with stop and target prices for active fade setups.
The setup engine includes a time-remaining guard: when fewer minutes remain in the extension than the configured threshold, time-sensitive setups (fades and gap targets) are suppressed and the panel shows a "late session" status instead.
## How To Use It
- A range outline box appears over the range window once the window closes — this is the visual reference for the session range.
- Six pairs of lines extend forward from range-end to extension-end at multiples 1, 2.5, 5, 8, 13, and 19 of the range above and below the range high and low.
- Numerical labels at each level show the multiple — labels can be placed at the left or right end of the line via the "Level Label Side" setting.
- The gap line appears horizontally at the gap price after the configured gap time and extends until either price crosses through it during the fill window or the next day's gap is set.
- The live stats panel shows current price location vs midline (in range-multiples), today's range vs historical average, the current zone between two adjacent levels, the furthest level tagged today, per-level historical touch and revert rates, gap fill statistics, and a live setup suggestion.
Recommended timeframes: 1-minute through 1-hour. The script always uses 5-minute data internally, so behavior is consistent across chart timeframes.
Recommended markets: 24-hour markets such as index futures (ES, NQ), major FX pairs, and crypto majors, where overnight session structure matters and the configured NY-time windows align with meaningful session boundaries.
Avoid using when: less than 30 sessions of chart history are loaded (statistics will be unreliable) or on instruments that close before the configured range window (the range simply will not populate).
## Settings
- Max Deviation Days (default 11): how many past days to keep deviation levels visible. Older days are removed automatically.
- Show Deviation Levels: toggle the level lines.
- Normalize Range Size: when on, the range box and level distances use the average range over N past days instead of today's actual range.
- Normalize over N Days (default 500): number of past days to average for the normalization.
- Range Start and End Hour and Minute (default 19:30 to 20:30 NY): the window during which the range is captured.
- Extension Start and End Hour and Minute (default 20:30 to 16:00 NY next day): the window during which the deviation levels are drawn forward.
- Show Gap Level: toggle the gap line.
- Max Gap Days (default 11): number of past gap lines to keep visible.
- Gap Time Hour and Minute (default 15:55 NY): the 5-minute bar whose close becomes the gap price.
- Gap Close Start and End Hour and Minute (default 09:30 to 16:00 NY next day): the window during which gap fill is detected.
- Show Range Outline (default on): toggle the range outline box.
- Range Outline Color, Width, Style, Fill Transparency: visual settings for the box.
- Gap Width, Style, Color: visual settings for the gap line.
- Levels Width, Style: visual settings for the deviation lines.
- Level 1 through Level 6 (defaults 1, 2.5, 5, 8, 13, 19): numeric multiples of the range used for each level pair.
- Level 1 to 6 Color: per-level color.
- Level Label Side (default Left): place the level number labels at the left or right end of each line.
- Font Size (default 9): label font size.
- Show Stats Table (default on): toggle the live statistics panel.
- Stats Lookback in Days (default 5000): number of past completed days to include in historical statistics. Higher means more reliable percentages but requires more chart history loaded.
- Min Revert Percent for Fade Setup (default 55): a FADE setup is suggested only if the historical mean-revert rate at the touched level is at or above this threshold and the level was tagged at least 3 times in the lookback.
- Min Remaining Minutes for Setup (default 60): suppresses time-sensitive setups when fewer than this many minutes remain in the extension. Set to 0 to disable.
- Table Position (default Top Right): where the stats table is anchored.
- Table Size (default Normal): text size inside the stats table.
- Bull / Setup Color, Bear / Warning Color, Table Background, Table Text, Table Border: color settings for the panel.
## Alerts
Five alert conditions are exposed and can be selected from TradingView's "Add Alert" dialog:
- Range Locked: fires when the range window closes and the levels are projected.
- Level Tagged: fires the first time price reaches any deviation level on either side.
- Gap Set: fires when the daily gap level is captured.
- Gap Filled: fires when price crosses through an open gap during the fill window.
- Session End: fires when the extension window ends and stats are finalized.
## Notes
The script does not repaint after a 5-minute bar closes. The range, deviation levels, and gap line are drawn from confirmed data only. The live distance-from-midline and live setup suggestions update intrabar based on current price.
Future bar-index positions for projected lines and labels are estimated based on the chart timeframe's bar duration. On charts with weekend gaps the projected end positions may visually diverge from the configured extension-end time by a small amount, but the underlying logical end time is correct.
Indicatore

Quantum Liquidity Map - VP, VWAP & CVD Confluence [NikaQuant]Info:
An overlay that combines three institutional order-flow methods — visible-range Volume Profile, session-anchored VWAP with standard-deviation bands, and Cumulative Volume Delta with divergence detection — into one coordinated tool for reading liquidity and order-flow conviction.
## Why This Combination Exists
Each of the three methods answers a different question about price, and none of them can answer the others alone. Volume Profile answers "where has the market actually traded?" — it locates the price levels participants have defended with size. Anchored VWAP answers "how far is the current price from the session's true volume-weighted average?" — it measures stretch from fair value. CVD divergence answers "is this move real?" — it exposes when a new price high or low is being printed on weakening order-flow pressure.
Used in isolation, each method produces false signals. A Value Area edge can be tagged without any participation. A VWAP band touch can continue for hours without mean-reverting. A CVD divergence can fire in a vacuum away from any structural level. The coordination is the entire point of this script: a Value Area edge touched while price is already two standard deviations stretched from VWAP, with a confirmed CVD divergence printing at the same bar — three independent systems agreeing — is a structurally different event than any one of them firing alone. The script exists to make that specific confluence visible in a single overlay without chart clutter or flipping between tools.
## How It Works
Volume Profile — The visible range is split into horizontal price buckets. Each completed bar's volume is distributed into the bucket containing its midpoint. The highest-volume bucket becomes the Point of Control (POC). From the POC outward, buckets are added alternately above and below (whichever neighbour carries more volume) until a configurable percentage of total volume is captured — 70% by default, following the CBOT value-area method. The upper and lower boundaries of that expansion become Value Area High (VAH) and Value Area Low (VAL). A previous-session POC that current price has not yet revisited is drawn as a "naked POC" — an untested volume cluster that tends to act as a magnet.
Anchored VWAP — The volume-weighted average price is calculated from scratch each time the anchor period resets (thirteen anchor options from one hour through yearly). Two standard-deviation bands are derived from the running variance of the weighted price distribution, with multipliers adjustable for both the inner and outer bands. Bands are deliberately suppressed for the first five bars of every new anchor period, because variance is mathematically unstable immediately after a reset and early spikes would be misleading.
CVD Divergence — Cumulative Volume Delta is estimated per bar using the close-location-within-range method: a bar that closes near its high is interpreted as predominantly buy-driven, one that closes near its low as sell-driven, and the net difference is summed across the session. Structural swing highs and lows are detected with equal left and right confirmation windows, which prevents repainting because a pivot is only recognised once both sides are closed. A divergence is flagged only when three conditions are met: (1) price prints a new swing extreme relative to the previous one, (2) the CVD value at that swing fails to confirm the new extreme, and (3) the swing itself exceeds 1.5 times the 14-bar Average True Range. The ATR gate is the key noise filter — it throws out minor pivots that would otherwise generate meaningless divergences during tight consolidations.
## How To Use It
- Start with the profile: locate POC, VAH, and VAL. These are the decision levels.
- Check the VWAP band zone (shown live in the dashboard). Inside ±1 standard deviation of VWAP, price is near fair value. Beyond ±2 standard deviations, it is statistically stretched and mean-reversion odds improve.
- Look for confluence at profile levels. A rejection candle at VAH while price is also outside the +2 standard deviation band on VWAP and a bearish CVD divergence has just fired is the highest-probability setup the indicator produces. The inverse applies at VAL.
- A naked POC tag accompanied by CVD trending in the same direction as the test is more likely to hold than one where CVD disagrees.
- Recommended timeframes: 5-minute through 4-hour for intraday; 1-hour through daily for swing. The VWAP anchor period should match the trading horizon — Session for intraday, Weekly or Monthly for swing.
- Recommended markets: liquid futures, major FX pairs, large-cap equities, and liquid crypto perpetuals — any market where per-bar volume is meaningful enough for the close-location-within-range buy/sell estimate to be informative.
- Avoid using on illiquid symbols where volume is sparse or spiky, and on non-standard chart types (Heikin Ashi, Renko, Kagi, Point & Figure, Range) — they distort both the profile inputs and the CVD calculation.
## Settings
- Profile Rows (default 60): number of horizontal buckets. Higher values give finer resolution at the cost of more noise per bucket.
- Value Area % (default 0.70): volume percentage that defines the value area, following the CBOT convention.
- Lookback Bars (default 48): how many completed bars of history feed the profile.
- Show Naked POC (default on): draws previous-session POCs that current price has not yet revisited.
- Profile Width (default 0.30): horizontal footprint of the heatmap as a fraction of the lookback window.
- CVD Pivot Lookback (default 5): bars required on each side to confirm a swing. Higher values produce fewer but stronger divergence signals.
- VWAP Period (default Session): anchor period from one hour through yearly.
- Inner SD Multiplier (default 1.0) and Outer SD Multiplier (default 2.0): standard-deviation band widths.
- Dashboard position, size, and dark-mode toggle: cosmetic only.
## Alerts
Four alert conditions are included, each with a JSON payload suitable for webhook routing:
- Price touches POC (within half an ATR)
- Price enters the VAH zone
- Price enters the VAL zone
- CVD divergence detected (bullish or bearish)
## Notes
- Non-repainting. Divergence signals fire only on confirmed (closed) bars and require both-sided pivot confirmation. The profile, VWAP and CVD values use historical bar data only, with no lookahead.
- The CVD estimate is range-based (close-location-within-range), not tick-based. On very short timeframes, where a single bar can contain many aggressive sweeps, this is an approximation of true order flow — it correlates well with tick CVD on liquid instruments but is not a substitute for it on sub-minute scalping.
- Overlay indicator, pinned to the right scale. Pine Script v6.
─────────────────────────────────────────
════════════════════════
Indicatore

FX Round LevelsFX Round Levels — 整数位水平线
自动在图表上绘制心理价位(整数位)和中间位水平线,适用于外汇、指数、加密货币等所有品种。
功能特点
整数位(xx.00):自动计算并显示当前价格附近的整数关口
中间位(xx.50):可选显示整数位中间的半数关口
重要整数位高亮:自动识别 xxx000 / xxx500 等关键整百/整五百位,以不同颜色突出显示
价格标签:每条线旁显示精确价格,偏移量可调
全品种自适应:自动检测小数位数,兼容所有货币对及品种
完整自定义:颜色、线宽、线型(实线/虚线/点线)均可独立设置
显示数量可控:默认显示当前价格上下各 15 条,最多支持 200 条
适用场景:支撑/阻力分析、关键价位识别、价格区间参考
--------------------------------------------------------------
English Version
FX Round Levels — Psychological Price Levels
Automatically plots round number levels and mid-point levels on your chart. Works on any instrument — Forex, indices, crypto, commodities.
Features
Round levels (xx.00): Auto-calculated whole-number price levels around current price
Mid levels (xx.50): Optional half-figure levels between round numbers
Significant level highlight: Distinguishes major levels (xxx000 / xxx500) with a separate color
Price labels: Precise price tag beside each line, with adjustable offset
Universal compatibility: Auto-detects decimal places, works on any symbol and timeframe
Full customization: Independent color, width, and style (Solid / Dashed / Dotted) for round and mid levels
Adjustable count: Default ±15 levels around price, up to 200 total
Use case: Support/resistance analysis, key price identification, range reference Indicatore

Indicatore

Gann Sq9 Levels - @darshaksscGann Square of 9 (Sq9) is one of W.D. Gann's most powerful tools for identifying
price support and resistance levels. This indicator applies the core Sq9 formula —
stepping ±0.25 increments on the square root of a base price — to automatically
plot key levels directly on your chart.
𝗛𝗼𝘄 𝗶𝘁 𝘄𝗼𝗿𝗸𝘀:
The indicator takes a base price (session high/low midpoint, session open, previous
close, or manual input) and calculates symmetrical resistance levels (R1–R6) above
and support levels (S1–S6) below using the Gann Sq9 formula:
Level = (√Base ± n × 0.25)²
𝗙𝗲𝗮𝘁𝘂𝗿𝗲𝘀:
- Automatic Gann Sq9 support and resistance levels
- 4 base price modes: Session Mid, Session Open, Previous Close, Manual
- Clean dashboard showing R3 → LTP → S3 at a glance
- Price proximity alerts when approaching key levels
- Fully customisable colors and level count (1 to 10 each side)
- No repainting — all levels calculated and drawn on confirmed data
- Works on all instruments and timeframes (best on 5m, 15m, 1H intraday)
𝗛𝗼𝘄 𝘁𝗼 𝘂𝘀𝗲:
R1 and S1 are your primary levels for the session. Price respecting R1 = bearish
bias; price holding above S1 = bullish bias. Use R2/S2 as targets and R3/S3 as
extended targets or stop zones.
𝗕𝗮𝘀𝗲 𝗣𝗿𝗶𝗰𝗲 𝗚𝘂𝗶𝗱𝗲:
→ Session Mid (H+L/2) — recommended for intraday
→ Session Open — for gap-based analysis
→ Previous Close — for overnight/positional setups
→ Manual — for custom anchoring to any reference price
𝗧𝗶𝗺𝗲𝗳𝗿𝗮𝗺𝗲𝘀: Best on 5m / 15m / 30m / 1H
𝗜𝗻𝘀𝘁𝗿𝘂𝗺𝗲𝗻𝘁𝘀: Indices, Stocks, Futures, Forex, Crypto
⚠ This indicator is for educational and analytical purposes only.
It does not constitute financial advice. Always use your own judgment and
risk management when trading. Indicatore

Liquidity Reaction Market Context FrameworkDescription
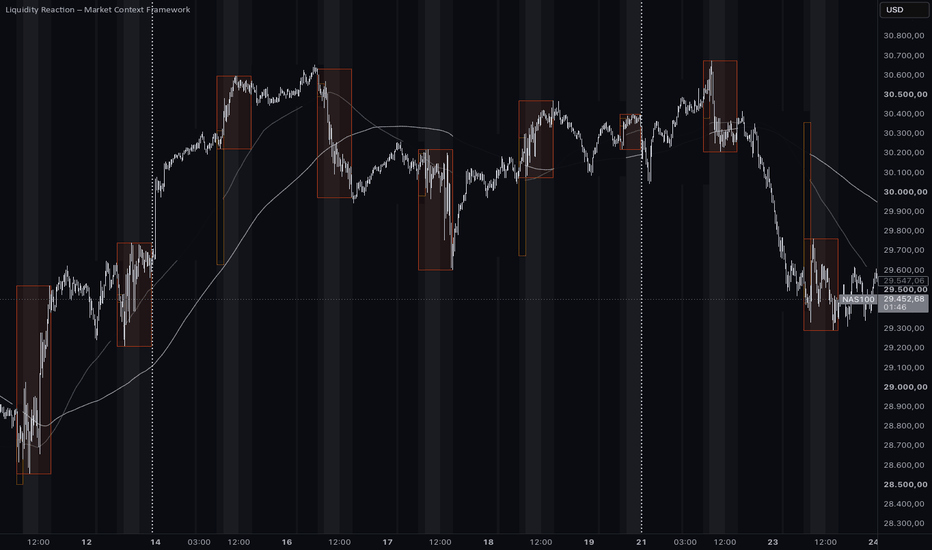
Liquidity Reaction – Market Context Framework is a structured visual tool designed to provide traders with clear market context based on session behavior, time-based positioning, and key reference levels.
This script does not aim to generate signals. Instead, it builds a contextual framework that helps traders understand how price evolves across different trading sessions and how liquidity transitions occur throughout the day.
Core Concept
Markets do not move randomly — they evolve through time-based cycles, where each session contributes to liquidity creation, expansion, and rebalancing.
This indicator organizes that behavior into a unified structure, allowing traders to:
Identify where price is within the daily cycle
Understand how sessions interact with each other
Detect where liquidity is likely being formed or consumed
Track how price reacts to prior session ranges and reference levels
Components
1. Sessions (Day, Asia, London, New York)
Each session is represented as a dynamic range (high–low) that evolves in real time.
Purpose:
Define structural ranges
Highlight consolidation and expansion phases
Provide context for intraday positioning
2. Session Close–Open Relationship (Gap)
The script tracks the relationship between the previous reference close and the next session open.
Purpose:
Identify imbalance zones
Highlight potential rebalancing areas
Provide a key reference for intraday reactions
3. Time Zones (Background Context)
Background shading represents key trading windows in New York time.
Purpose:
Provide temporal orientation
Align price action with institutional trading hours
Improve session-based analysis
4. Extended Hours
Marks low-liquidity periods outside primary sessions.
Purpose:
Contextualize reduced participation
Identify transitions between active and inactive markets
5. SMA 200
A long-term moving average included as a structural reference.
Purpose:
Provide directional bias context
Help visualize broader market positioning
Why This Script Is Different
Unlike traditional indicators that focus on signals or isolated calculations, this script is built as a contextual framework.
It integrates multiple time-based elements into a single, coherent structure that reflects how markets actually operate:
Through sessions
Through time
Through liquidity transitions
How to Use
Use sessions to understand where price is developing structure
Observe how price behaves when entering or leaving a session
Use the gap as a reference for imbalance and potential reaction
Align execution with time zones rather than arbitrary signals
Use SMA 200 as a higher-level directional filter
Notes
This indicator is designed to be used directly on the main chart
For proper visualization, place it above in the object tree
Works best on intraday timeframes where session behavior is more relevant
Each component can be enabled or disabled and limited by timeframe
This script is intended for traders who prioritize context over signals, and who want to understand the structure behind price movement, not just its outcome. Indicatore
Indicatore

Indicatore