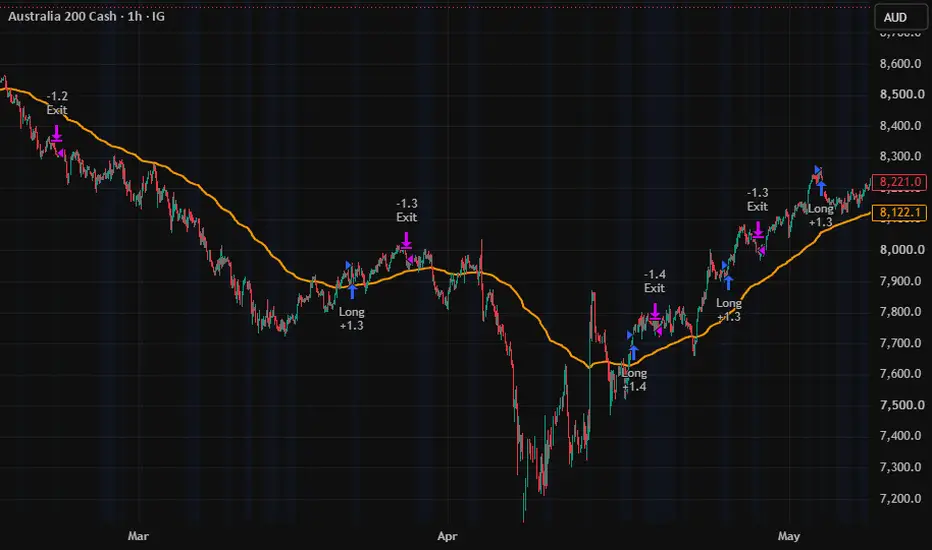
ATR DisplayerDisplays ATR in tick in the corner of your chart. You can choose the corner, the colors, and the periodicity of the ATR. Indicatoredi Fractal_Firmament5
ATR Body HighlighterHighlights bars whose bodies are more than n * ATR (e.g 1.5 times ATR). You can choose the ATR multiplier, the highlighting color, and the opacity. Indicatoredi Fractal_Firmament3
50MA ATR ExtensionThis indicator measures how many 14-day ATRs price is trading away from its 50-day moving average. It's designed to identify when a trend has become unusually stretched relative to recent volatility.Indicatoredi davidscutt4
Untested Swing Wick Levelsmarks out swing highs and swing lows. makes a horizontal line on the wick where price has not yet touched it.Indicatoredi J09C10
NG Trendlines & Market Structure# NG Trendlines & Market Structure NG Trendlines & Market Structure is a proprietary trading indicator designed to identify high-probability market structure, trendline compression, and breakout opportunities. The indicator combines dynamic trendlines, higher-timeframe directional bias, support and resistanceand market structure analysis to help traders identify periods of consolidation before momentum expansion. ## Features * Automatic trendline detection * Compression and breakout identifiIndicatoredi Im_nngAggiornato 9
EMA 10/30 Trend Box Deboshree ShawEMA 10/30 Trend Box with Buy/Sell Signals Overview The EMA 10/30 Trend Box is a simple yet powerful trend-following indicator designed to help traders quickly identify market direction and potential entry opportunities. By combining the speed of the 10-period EMA with the reliability of the 30-period EMA, this indicator highlights bullish and bearish trend shifts using visual signals and an easy-to-read trend dashboard. Key Features ✅ EMA 10 & EMA 30 crossover detection ✅ Instant BUY signalIndicatoredi divyanibesh50
Multi Trend Score OscillatorsOscillators Multi Trend score Part 1: How the Indicator Works Under the Hood //The script evaluates the market using three independent concepts: Trend Direction, Momentum, and Market Regime (Volatility). It works on a strict point system that ranges between a maximum bullish score of +2.0 and a maximum bearish score of -2.0. Trend Filter (Moving Averages): Max +/- 1.0 Point It checks a fast 15 EMA and a slower 50 EMA. Bullish (+1.0): If the 15 EMA is above the 50 EMA and the price is tradiIndicatoredi malqaizi14
[ A L P H A X ] PIVOT - Smart Money StructureAlphaX PIVOT — Smart Money Structure + OTE Pullback Engine: Market Structure Tracking, Optimal Trade Entry Zones, Liquidity Sweep Detection & 7-Layer Confluence Scoring AlphaX PIVOT is a professional-grade smart money pullback system built around two of the most powerful concepts in institutional price action: market structure and the Optimal Trade Entry zone. Where breakout-based systems enter at the moment of structural displacement — chasing the move after it has already begun — PIVOT waitsIndicatoredi AlphaX-Trade1182
3% max drawdown - Performs just as good as NasdaqHi everyone, this pine script best works on NDQ and SPX. It has a roughly 3% max drawdown over 21 years!! Also, It performs Just as good as Nasdaq and the S&P 500! EnjoyStrategiadi finnick1111285
Early Reversal Candlestick Pattern Early Reversal Candlestick Pattern Indicator (TradingView Pine Script v6) Identify high-probability market reversals with this advanced candlestick pattern indicator. The script automatically detects and confirms multiple bullish and bearish reversal setups, helping traders spot potential trend changes with greater confidence. ✅ Included Patterns 🔹 Inside Bar Breakout (Bullish) 🔹 Inside Bar Breakdown (Bearish) 🔹 Hammer Confirmation (Bullish) 🔹 Shooting Star Confirmation (Bearish) 🔹 Bullish EIndicatoredi ChartTrader-X47
Momentum Squeeze Breakout EngineDescription *Momentum Squeeze Breakout Engine* is a quantitative, trend-following breakout strategy engineered to capture explosive directional moves emerging from periods of asset compression (squeezes). By combining precise volatility boundaries, structural market sentiment filters, and micro-momentum triggers, this strategy systematically avoids false breakouts. ### Core Mechanics & Features 1. Volatility Squeeze Identification The foundation of this strategy relies on the relationship bStrategiadi Pridarasx37
VIX Charting + TableBuilt this one specifically because most VIX scripts cheat. My most important and most useful indicator by far. They request the 15-minute VIX with lookahead on, which leaks the end of the period back to its start on historical bars, so the backtest looks sharper than anything you'd get live. This version only uses confirmed data, so the history and the live read match. Use it as a directional gate for index futures: VIX falling favors longs, VIX rising favors shorts, and what you see on the chaIndicatoredi AdaptiveIndicators12
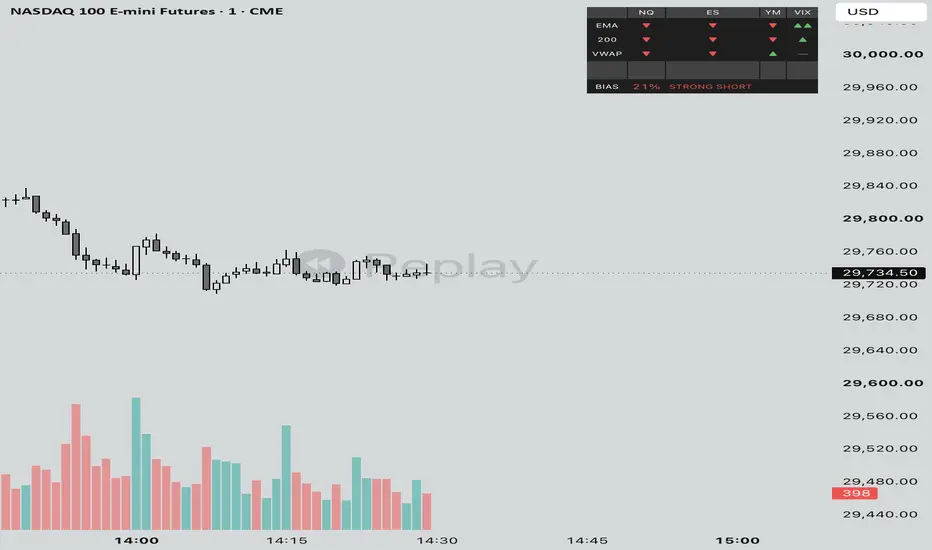
Correlated Assets TableA quick cross-check on whether the rest of the complex agrees with you. It tracks NQ, ES, YM, and the VIX and shows, for each, where price sits against an EMA envelope. A move with all three indices pulling the same way and VIX cooperating is worth more than NQ running by itself. Only take your chart's signal when the table backs it, and treat a split as a yellow light. Each symbol comes in through request.security, so the values settle as bars close. It's confirmation, not a precise entry clockIndicatoredi AdaptiveIndicators3
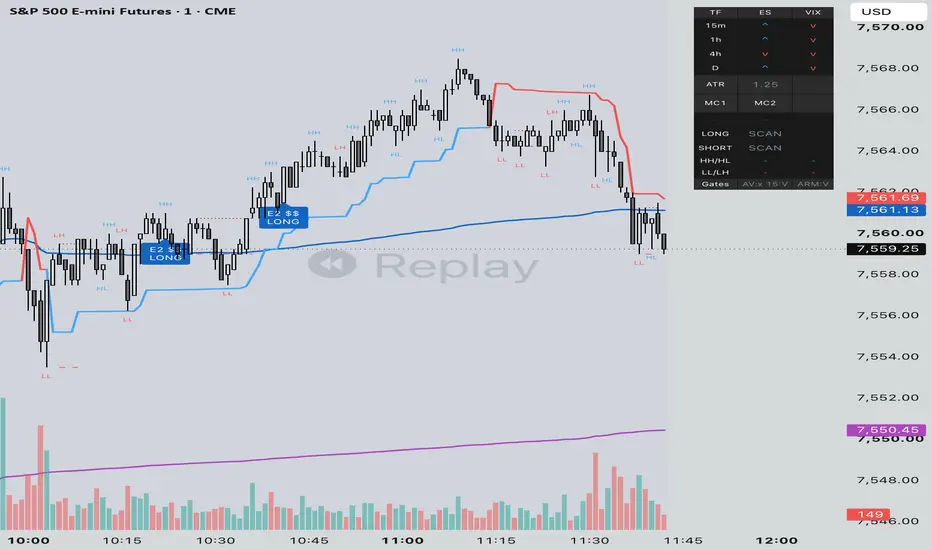
Vol & Trend TableA heads-up table so you're not eyeballing the VIX every two minutes. It reads VIX through a Twin Range Filter across a few timeframes to show the risk regime, and works out an ATR-based stop distance (2.2x by default) so you can size without doing math mid-trade. Glance at it for risk-on versus risk-off and the stop number before you take a setup from your main system. It doesn't fire entries itself. The VIX and multi-timeframe reads use lookahead, so on history the table can show a state earlieIndicatoredi AdaptiveIndicators5
ATR Breakout EngineSame multi-timeframe idea as the ATR Bands, except this one's a signal tool, not just lines. It builds a session reference and an ATR for the 1m, 5m, and 15m, works out a breakout level for each, and fires an arrow when 1-minute price crosses one. When a few timeframes break together you've usually got something with legs. It doesn't place orders, so pair it with the strategy version if you want the backtest numbers. Set the session timezone to your cash open. It uses higher-timeframe requests, Indicatoredi AdaptiveIndicators10
ATR Stop Loss VisualizerThis script provides a line and label of a custom set ATR and provides risk settings so you can enter trades knowing exactly how to size based on current volatility of price action. it's adjustable risk settings, label, and a dashboard. Indicatoredi TradePlusEV50
ES Morning System (VIX and TRF + Candle Patterns)Same idea as my NQ work, tuned for ES on the 1-minute in the morning. It marks swing pivots off candle-color flips (green-to-red is a high, red-to-green is a low) and waits for a higher-high, higher-low structure that then takes out the prior high. The piece that makes it different: nothing arms until price actually touches VWAP. Once it's armed you need price above both the session and overnight VWAP with the 15-minute pointing your way, and it grades // /$/$$$ by how many higher timeframes agrIndicatoredi AdaptiveIndicators11
NQ Unified (VIX + HTF TRF)This is the NQ system I actually trade off of, on the 1-minute during the cash session. The trigger is a Twin Range Filter cross, but it only counts when the regime agrees: VIX dropping on the 15-minute means I want longs, VIX spiking means shorts, and the higher timeframes (15m and up) have to point the same way. When it all stacks it prints a long on the up-cross or a short on the down-cross, grades the setup $ to $$$ by how much confluence is behind it, and drops a 2.2x ATR stop from entry. TIndicatoredi AdaptiveIndicators9
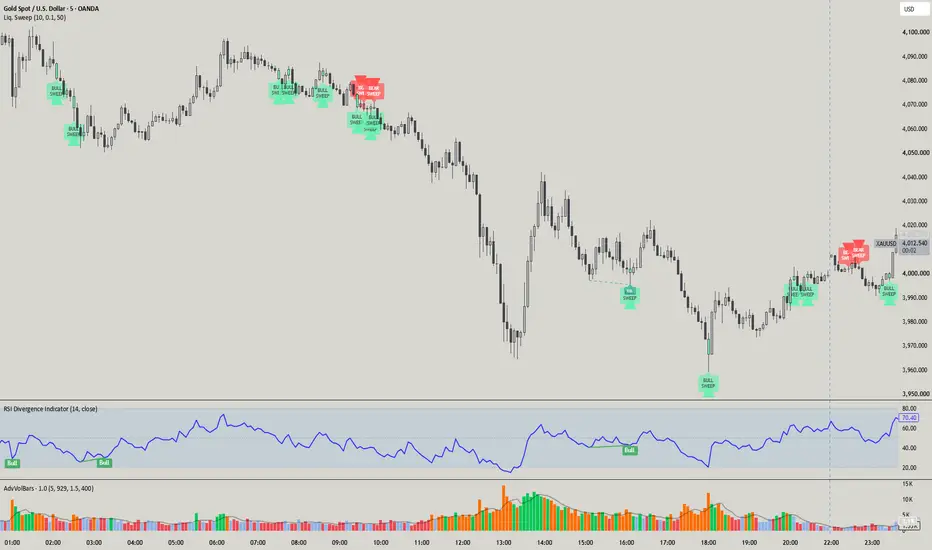
Liquidity Sweep Detector [Proozac]# Liquidity Sweep Detector **Pine Script v6 — Overlay Indicator** --- ## What It Does Detects two related concepts from institutional liquidity theory: 1. **Equal Highs / Equal Lows (EQH / EQL)** — price levels where the market reached the same high or low on two separate occasions. These levels concentrate retail stop orders (buy stops above EQH, sell stops below EQL) and act as magnets for institutional order flow. 2. **Liquidity Sweep** — when price breaks through an EQH or EQL with a wIndicatoredi Proozac9831
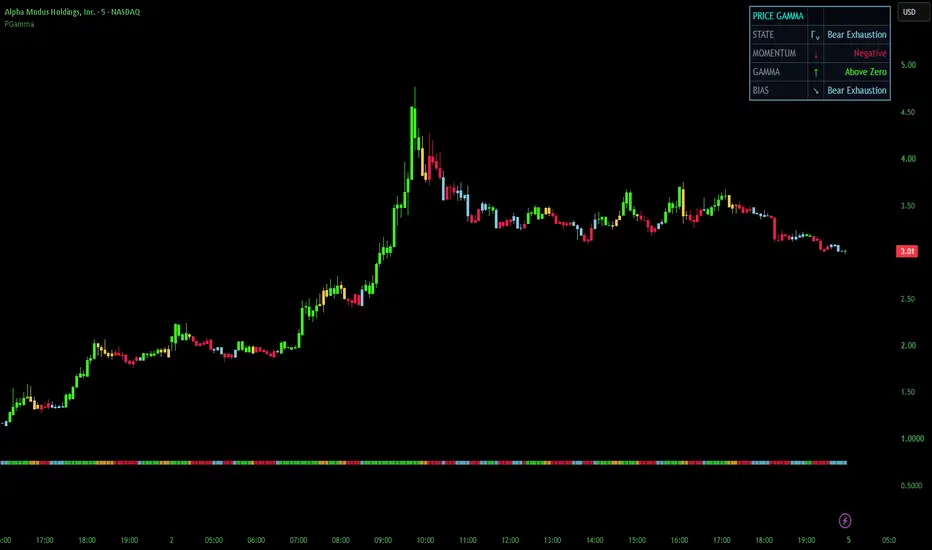
Precision Price Gamma [PGamma]Here's the full updated description with all the fixes — car analogy corrected, image captions added, ready to copy: Precision Price Gamma (PGamma) is a second-derivative momentum indicator that measures the acceleration of momentum, not momentum itself. ━━━━━━━━━━━━━━━━━━━━━━━━━━ WHY PGAMMA IS DIFFERENT ━━━━━━━━━━━━━━━━━━━━━━━━━━ Most momentum indicators tell you how strong a move is. PGamma tells you whether that strength is increasing or fading — going one step further by measuring whetherIndicatoredi MohaveTraderAggiornato 792
Multi-Timeframe Trend Table (Weighted)**Multi-Timeframe Trend Table (Weighted) — Market Bias Dashboard** This indicator is a **multi-timeframe trend analysis system** designed to evaluate overall market direction using a weighted combination of **ATR trend structure, Stochastic RSI momentum, and Moving Averages** across multiple timeframes. It aggregates data from higher to lower timeframes into a single **bias scoring table**, giving traders a clear, structured view of market sentiment and directional strength. --- ### 🔍 Core CIndicatoredi DigiDavesData15
Rolling ATR Channel The Rolling ATR Channel is a volatility and trend-following indicator designed to identify breakout opportunities while filtering lower-quality counter-trend signals. It combines ATR-based dynamic price channels, a Rolling Donchian Cloud, and a moving average direction filter to improve trade clarity and market structure awareness. This tool is built to help traders identify: Trend continuation opportunities Breakout confirmations Volatility expansion zones Directional bias High-probability tIndicatoredi DigiDavesData26
ORB Dashboard ProORB Dashboard Pro provides real-time Opening Range analytics designed to answer the questions most ORB traders never ask. Instead of simply marking the opening range, the dashboard continuously measures how today's session is developing relative to historical behavior. The indicator tracks Opening Range structure, session development, acceptance above or below the range, expected expansion potential, and overall market phase. The result is a powerful decision-support tool that helps traders qIndicatoredi christophercberg14