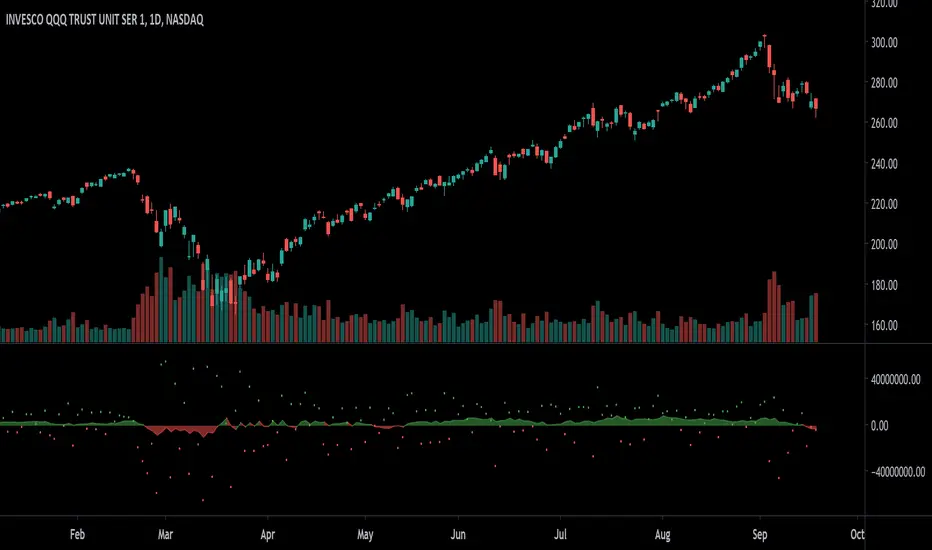
Anti-Volume Stop LossFINALLY!
As everyone who tried to create, understand, or even find the Buff Pelz Dormeier Anti-volume stop-loss indicator knows that - it's not easy. Personally, I have partially, or perhaps completely figured out, the tips Buff had given in Investing with Volume Analysis book.
AVSL now is ready.
Please do some test and give me a feedback how it works in your trade strategy.
Anti-Volume stop loss - AVSL
from Investing with Volume Analysis book CHAPTER 20 • RISKY BUSINESS 253-256:
"It is imp
Indicatore volume
DTR vs ATR w RVolDTR vs ART along with Relative Volume in Percentage. So if you see RVol as 200% with input length of 10 days, today's volume is 2x compared to past 10 days. It helps if today's volume is already reached 20% or 30% within 30mins of market open, etc.
Indicatore
WholvolTotal Volume Of Crypto Pairs Based on TV Top Exchanges
See the whole volume with additional feature and options.
Report volume data in USD, BTC, itSelf.
See each exchange Share and Volume.
Static and Dynamic value filtering.
MAs crosses.
Note.1
Due to the pine limitations, we have selected the most important Exchanges which have valuable volume.
Note.2
When you choose to report stats in BTC unit and you have chart of altcoins, the BTC source price will extract from your pair exchange.
Indicatore
Trend Thrust Indicator - RafkaThis indicator defines the impact of volume on the volume-weighted moving average, emphasizing trends with greater volume.
What determines a security’s value? Price is the agreement to exchange despite the possible disagreement in value. Price is the conviction, emotion, and volition of investors. It is not a constant but is influenced by information, opinions, and emotions over time. Volume represents this degree of conviction and is the embodiment of information and opinions flowing through i
Indicatore
Heatmap Volume [xdecow]This indicator colors the volume bars and candles according to the volume traded. The calculation of the heat map zones is done as follows:
how many standard deviations the volume are distant from the average volume?
For a better visual experience, place the borders and wicks of the candles in a neutral color.
Banabi Hacim by HassonyaThe Banabi Hacim indicator shows you the movement of volume in the last bar in terms of percentage buying and selling directions. You can use it in any period you want. It is designed to help you and give you ideas for buying or selling. It will be your assistant in critical places where you are thinking of buying or selling.
Thanks for supports
TÜRKÇE AÇIKLAMA
Banabi Hacim indikatörü size son barda gerçekleşen işlem hacim hareketini yüzdesel olarak alış ve satış yönlü olarak gösterir. İst
Indicatore
Delta Volume Weighted - IntradayResets at the start of the day's session (9:50 am on the ASX).
Takes the first candle and checks if its a green candle (close > open), and adds the volume to a total (which starts at 0 at the start of the day).
Subtracts it if the candles in red.
Continues to do this along with all the candles.
The volume is also multiplied by the difference between open and close so that large candles with large volume have more weight and move the indicator more.
Indicatore
Market EmotionsThis is a simple and fun indicator I built out of boredom one night. It's great for a quick laugh, but other than that, it's useless. It simply displays emotes for various thresholds of change in price between the open and close of a candle. For example, unicorn candles are any candles that gain 25% or more from opening price to closing price.
Indicatore
Aggregate BTC VolumeSimple script that shows the aggregate volume of BTC, taking volume data from top spot and derivative exchanges.
Indicatore
Price/Volume Value HistogramAn interesting implementation of mine to measure an asset changes based on asset price velocity and volume velocity. The indicator acts as asset value calculator. Long and Short.
==Points System Rules==
UPTRENDING
If Current Close is higher than previous Close and Current Volume is bigger than previous Volume: Adds Close Points and Volume Points
Otherwise check
If Current Close is higher than previous Close: Adds Only Close Points
DOWNTRENDING
If Current Close is lower than previous Close and
Indicatore
Indicatore
Bitcoin M2 supply adjusted priceThis script plots bitcoin candles adjusted by M2 supply (blue line), helping the trader to obtain insight of new support/resistance levels adjusted by M2 supply.
Note: As it was not possible to make the price adjust automatically by the last M2 value (pinescript limitation, I guess), the input parameter "M2Last" must be updated manually observing the last M2 value in blue curve.
Indicatore
Volume Brakeout v1Volume Brakout indicator is used to help determine trend direction strictly based on Negative and Positive volume data.
How to Read:
- Moving Average crossovers are used to help determine a possible trend change or retracement.
- The area cloud on the bottom is calculated by the difference of the moving averages. This could be used to help determine the trending volume strength.
- Bright colored volume bars are large volume spikes calculated by the x factor in the options.
Other changes:
- Vol
Indicatore
Cumulative Volume v3The script, for Pine Script version 3, shows how to accumulate volume values during a defined session/period.
The input is the period to use for accumulation. "D" is the default value, useful to view data for each session.
This is slower than version 4 because there is no "var" and you need to use a loop. Also, you can't use "sum( volume , cnt_new_day)" with a variable length argument instead of "for".
Indicatore
DePriExchange weighted price for cryptocurrencies
DECENTRALIZED PRICE CHART FOR DECENTRALIZED WORLD
See non-manipulated , globally price action that comes from whole liquidity!
The main idea behind this script is that...
The value of each trading pair finally determined globally and the price displayed in exchanges is its own and not global! differences between exchanges, reduced to near zero gradually by market makers and arbitrages, so..
Every min tick price changes Must be backed by
Indicatore
DAX VolumeDAX index (DEU30) hourly volume indicator, which is obtained by adding the sum of the underlying stocks volume.
The volume is displayed in millions of EUR.
Indicatore
Closing RangeIndicator shows the closing range of each bar. Closing range is where the bar closes (high - close) relative to the length of the wick (high - low). A close at the top of the wick would be 100%, middle 50%, bottom 0%.
In addition, the indicator multiplies closing range by volume to weight toward high volume days.
A simple moving average is applied to visualize trend in volume-weighted closing range over time.
Options include changing the threshold of bullish closes. The default is 50%, but y
Indicatore
Delta Volume v2.1 by kernel_phiOld Version:
The source code of this script is now open. Feel free to modify it.
*** Not real-time. The indicator will be calculated only after a bar is closed. ***
Indicatore
Freedom of MovementFreedom of Movement Indicator
---------------------------------------------------------
In “Evidence-Based Support & Resistance” article, author Melvin Dickover introduces two new indicators to help traders note support and resistance areas by identifying supply and demand pools. Here you can find the support-resistance technical indicator called "Freedom of Movement".
The indicator takes into account price-volume behavior in order to detect points where movement of price is suddenly restricte
Indicatore
[WJ] - Corrected Seconds Volume** ONLY WORKS FOR SECONDS CHARTS **
After staring at a chart and scratching my head, I realized that the volumes were being incorrectly reported for lower time frames.
A chart that has no updated tick for 5 minutes will report the volume that occurred in the WHOLE 5 minutes - in one tick.
For a 5 second chart like above, we have now a chart that at first appearance is giving us numbers to believe that there is MUCH more liquidity than is real.
This can really confuse us, and other scripts th
Indicatore
MACD-X, More Than MACD by DGTMoving Average Convergence Divergence – MACD
The most popular indicator used in technical analysis, the moving average convergence divergence (MACD), created by Gerald Appel. MACD is a trend-following momentum indicator, designed to reveal changes in the strength, direction, momentum, and duration of a trend in a financial instrument’s price
Historical evolution of MACD,
- Gerald Appel created the MACD line,
- Thomas Aspray added the histogram feature to MACD
- Giorgos E. Siligardos
Indicatore
Large volume indicator to show the price above/belowLarge volume is meaningful that usually the current price above the highest price of the bars with largest volume usually means uptrend in the short-term.
In the opposite, below it means downtrend.
I coded this indicator to save the efforts to compare it, make it easily to tell the uptrend/downtrend by above/below and color.
Hope you guys enjoy it, and welcome to comment.
The Inputs:
Length:the largest volume of bars of the total bars numbers.
Color:the above/below colors.
Text:Remind this line
Indicatore
Volume-Weighted Indicators VWMA/VWAP/EMA_by WWAs traders and investors now urge to console volume factors into their price action analysis. This script is an attempt to combine volume-weighted moving average (VWMA), volume-weighted average price (VWAP), along with the exponential moving average (EMA). I have found that this indicator works quite well with the stock market.
How to use the indicator:
Buy when the VWAP and EMA lines crossing up VWMA.
Sell when the VWAP and EMA crossing down each other OR both VWAP and EMA crossing down VWAP
Indicatore
Nifty VolumeWhy this Script : Nifty 50 does not provide volume and some time it is really useful to understand the volume .
This is the pine script which calculate the nifty 50 volume .
Logic :
Take each stock contribute to nifty 50 and find it's volume .
Multiply the same with contribution percentage of the same on Nifty 50
Add up all of them and find the total volume .
There is a similar script by @daytraderph which is built for Bank Nifty (custom volume) . I took the same and built for Nfity.
Nift
Indicatore