
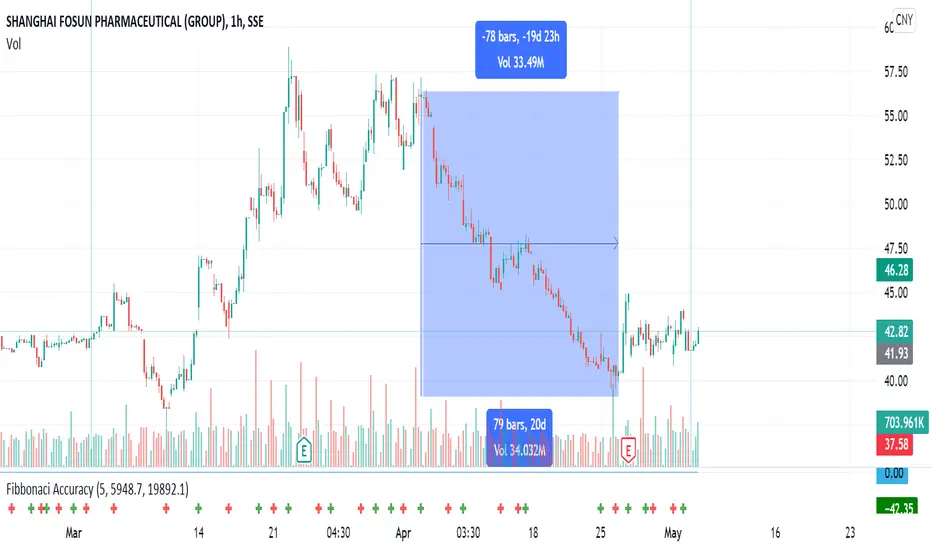
Fibonacci retracement with recent high and lows
The percentage retracements identify possible support or resistance areas, 23.6%, 38.2%, 50%, 61.8%, 100%. Applying these percentages to the difference between the high and low price for the period selected creates a set of price objectives.
Depending on the direction of the market, up or down, prices will often retrace a significant portion of the previous trend before resuming the move in the original direction.
These countertrend moves tend to fall into certain parameters, which are often the Fibonacci Retracement levels.
The percentage retracements identify possible support or resistance areas, 23.6%, 38.2%, 50%, 61.8%, 100%. Applying these percentages to the difference between the high and low price for the period selected creates a set of price objectives.
Depending on the direction of the market, up or down, prices will often retrace a significant portion of the previous trend before resuming the move in the original direction.
These countertrend moves tend to fall into certain parameters, which are often the Fibonacci Retracement levels.

免責事項
これらの情報および投稿は、TradingViewが提供または承認する金融、投資、取引、またはその他の種類の助言もしくは推奨であることを意図したものではなく、またこれらに該当するものでもありません。詳細は利用規約をご覧ください。
免責事項
これらの情報および投稿は、TradingViewが提供または承認する金融、投資、取引、またはその他の種類の助言もしくは推奨であることを意図したものではなく、またこれらに該当するものでもありません。詳細は利用規約をご覧ください。