
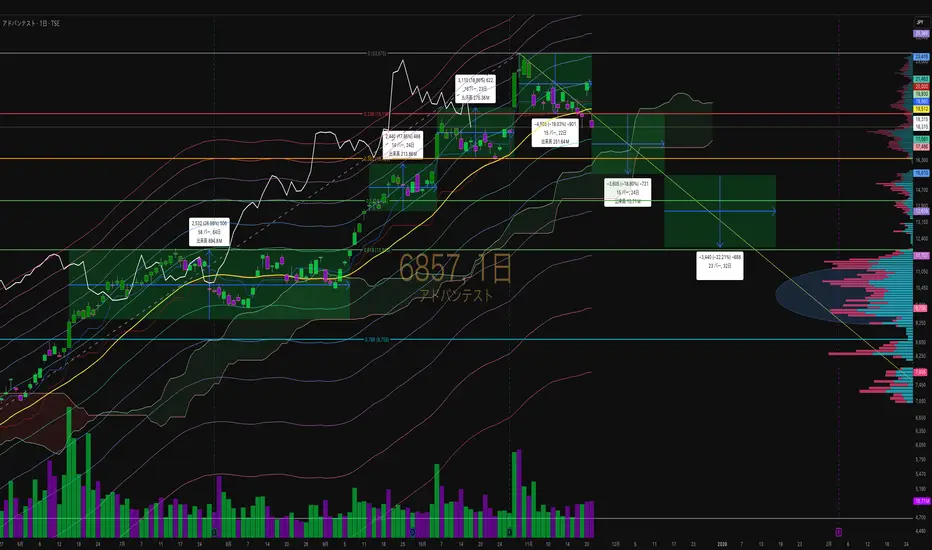
4月のトランプ関税懸念以降ずっと強かったアドバンテスト。
しかし 23,415円で天井をつけてから、流れがひとつ変わったように見える。
その理由はシンプルで、
株価が25日移動平均線(19,512円)を実体で割り込んだこと。
ここを割ると、短期の買いトレンドはいったん終わりやと判断されやすい。
⸻
■ まず意識する下落ターゲット
現在の動きから見ると、
最初に意識されるのは 17,000円(12月1〜4日付近)。
ここは:
• 一目均衡表・先行スパン1(雲の上限)
• 過去のレジサポが重なる位置
反発の入りやすい“最初の止まりどころ”になりやすい。
⸻
■ 強めのサポート帯
下げが継続する場合、
次に効いてくるのが 15,600〜16,000円 付近。
これは過去のボックス下限で、
何度も跳ね返されてきた“実質的な支持帯”。
⸻
■ この帯を割った時の展開
もし 16,500円をはっきり割る ようなら、
いよいよ下方向の勢いが加速する可能性が高い。
🔽 次のターゲットは:
• 14,185円(上昇全体の50%戻し)
• 11,000円(6月〜9月の主要レンジ帯)
11,000円付近は VPVR(価格帯別出来高)が最厚。
市場参加者が一番多い“メインレンジ”なので、
ここへ戻ってくるシナリオはかなり現実的。
さらに 12,000円を割れ ば、
次は 9,500〜12,000円の旧レンジ へ再突入するパターンも想定内。
⸻
■ 一目均衡表の視点
• 現在は雲に接触中
• 雲の下に潜り込めば、中期トレンドは一段下へ
• 逆に雲で支えられれば、25MAまでの戻りを挟む展開もあり
⸻
🎯 総まとめ
• 23,415円で天井をつけた形
• 25MAを実体で割った → トレンド転換の初動
• 短期ターゲット:17,000円
• 強めの支持:15,600〜16,000円
• 割れたら 14,185円 → 12,000円 →(状況次第で)11,000円 の流れ
• 一目均衡表も VPVR も “下方向優位” の状態
「戻り売りが上に重なりやすい局面に入った」と見るのが妥当。
Advantest (6857) — Entering a Potential Lower-High Cycle After Peaking at ¥23,415
After the strong uptrend that started with the Trump tariff headlines in April,
Advantest finally showed signs of exhaustion at ¥23,415,
and momentum has shifted.
The key trigger was simple:
the candle closed below the 25-day moving average (¥19,512).
This is typically recognized as the first signal of a short-term trend reversal.
⸻
Short-Term Downside Target
Based on the current structure,
the first level to watch is ¥17,000 (around Dec 1–4).
This level aligns with:
• The upper band of the Ichimoku cloud (Senkou Span 1)
• Prior support/resistance interaction
A natural spot for a temporary reaction.
⸻
Major Support Zone
If the decline continues,
the next stronger support is ¥15,600–¥16,000,
which represents the lower edge of the previous range —
a zone that has repeatedly held in the past.
⸻
If This Support Breaks
A clear break below ¥16,500 would likely accelerate downside momentum.
🔽 Key downside targets:
• ¥14,185 (50% retracement of the full uptrend)
• ¥11,000 (high-volume node & major range from June–September)
Since ¥11,000 is the thickest VPVR zone,
a return to this area is a realistic scenario.
If ¥12,000 fails,
price may re-enter the ¥9,500–¥12,000 historical range.
⸻
Ichimoku Perspective
• Price is currently touching the cloud
• A clean break below the cloud = medium-term downtrend confirmation
• A rebound from the cloud could push price back to the 25MA
⸻
🎯 Summary
• Clear top at ¥23,415
• Closing below 25MA triggered trend reversal
• First target: ¥17,000
• Strong support: ¥15,600–¥16,000
• Below that: ¥14,185 → ¥12,000 → ¥11,000
• Both Ichimoku and VPVR point toward downside bias
Market is now in a “sell-the-rally” environment rather than “buy-the-dip.”
#アドバンテスト #6857 #半導体 #日足分析 #テクニカル分析
#一目均衡表 #移動平均線 #雲割れ #戻り売り #トレンド転換
#フィボナッチ #価格帯別出来高 #VPVR #チャート分析
#株式投資 #日本株 #下落シナリオ #戻り売り優位 #需給分析
#投資戦略 #短期トレード #中期トレード
#Advantest #6857 #Semiconductor #TechnicalAnalysis #Ichimoku
#PriceAction #MA25 #TrendReversal #Fibonacci #VPVR
#VolumeProfile #ChartAnalysis #JapanStocks #StockMarket
#SellTheRally #DownsideRisk #TradingStrategy #SwingTrading
#MarketStructure #BearishSetup
しかし 23,415円で天井をつけてから、流れがひとつ変わったように見える。
その理由はシンプルで、
株価が25日移動平均線(19,512円)を実体で割り込んだこと。
ここを割ると、短期の買いトレンドはいったん終わりやと判断されやすい。
⸻
■ まず意識する下落ターゲット
現在の動きから見ると、
最初に意識されるのは 17,000円(12月1〜4日付近)。
ここは:
• 一目均衡表・先行スパン1(雲の上限)
• 過去のレジサポが重なる位置
反発の入りやすい“最初の止まりどころ”になりやすい。
⸻
■ 強めのサポート帯
下げが継続する場合、
次に効いてくるのが 15,600〜16,000円 付近。
これは過去のボックス下限で、
何度も跳ね返されてきた“実質的な支持帯”。
⸻
■ この帯を割った時の展開
もし 16,500円をはっきり割る ようなら、
いよいよ下方向の勢いが加速する可能性が高い。
🔽 次のターゲットは:
• 14,185円(上昇全体の50%戻し)
• 11,000円(6月〜9月の主要レンジ帯)
11,000円付近は VPVR(価格帯別出来高)が最厚。
市場参加者が一番多い“メインレンジ”なので、
ここへ戻ってくるシナリオはかなり現実的。
さらに 12,000円を割れ ば、
次は 9,500〜12,000円の旧レンジ へ再突入するパターンも想定内。
⸻
■ 一目均衡表の視点
• 現在は雲に接触中
• 雲の下に潜り込めば、中期トレンドは一段下へ
• 逆に雲で支えられれば、25MAまでの戻りを挟む展開もあり
⸻
🎯 総まとめ
• 23,415円で天井をつけた形
• 25MAを実体で割った → トレンド転換の初動
• 短期ターゲット:17,000円
• 強めの支持:15,600〜16,000円
• 割れたら 14,185円 → 12,000円 →(状況次第で)11,000円 の流れ
• 一目均衡表も VPVR も “下方向優位” の状態
「戻り売りが上に重なりやすい局面に入った」と見るのが妥当。
Advantest (6857) — Entering a Potential Lower-High Cycle After Peaking at ¥23,415
After the strong uptrend that started with the Trump tariff headlines in April,
Advantest finally showed signs of exhaustion at ¥23,415,
and momentum has shifted.
The key trigger was simple:
the candle closed below the 25-day moving average (¥19,512).
This is typically recognized as the first signal of a short-term trend reversal.
⸻
Short-Term Downside Target
Based on the current structure,
the first level to watch is ¥17,000 (around Dec 1–4).
This level aligns with:
• The upper band of the Ichimoku cloud (Senkou Span 1)
• Prior support/resistance interaction
A natural spot for a temporary reaction.
⸻
Major Support Zone
If the decline continues,
the next stronger support is ¥15,600–¥16,000,
which represents the lower edge of the previous range —
a zone that has repeatedly held in the past.
⸻
If This Support Breaks
A clear break below ¥16,500 would likely accelerate downside momentum.
🔽 Key downside targets:
• ¥14,185 (50% retracement of the full uptrend)
• ¥11,000 (high-volume node & major range from June–September)
Since ¥11,000 is the thickest VPVR zone,
a return to this area is a realistic scenario.
If ¥12,000 fails,
price may re-enter the ¥9,500–¥12,000 historical range.
⸻
Ichimoku Perspective
• Price is currently touching the cloud
• A clean break below the cloud = medium-term downtrend confirmation
• A rebound from the cloud could push price back to the 25MA
⸻
🎯 Summary
• Clear top at ¥23,415
• Closing below 25MA triggered trend reversal
• First target: ¥17,000
• Strong support: ¥15,600–¥16,000
• Below that: ¥14,185 → ¥12,000 → ¥11,000
• Both Ichimoku and VPVR point toward downside bias
Market is now in a “sell-the-rally” environment rather than “buy-the-dip.”
#アドバンテスト #6857 #半導体 #日足分析 #テクニカル分析
#一目均衡表 #移動平均線 #雲割れ #戻り売り #トレンド転換
#フィボナッチ #価格帯別出来高 #VPVR #チャート分析
#株式投資 #日本株 #下落シナリオ #戻り売り優位 #需給分析
#投資戦略 #短期トレード #中期トレード
#Advantest #6857 #Semiconductor #TechnicalAnalysis #Ichimoku
#PriceAction #MA25 #TrendReversal #Fibonacci #VPVR
#VolumeProfile #ChartAnalysis #JapanStocks #StockMarket
#SellTheRally #DownsideRisk #TradingStrategy #SwingTrading
#MarketStructure #BearishSetup

免責事項
これらの情報および投稿は、TradingViewが提供または承認する金融、投資、取引、またはその他の種類の助言もしくは推奨であることを意図したものではなく、またこれらに該当するものでもありません。詳細は利用規約をご覧ください。
免責事項
これらの情報および投稿は、TradingViewが提供または承認する金融、投資、取引、またはその他の種類の助言もしくは推奨であることを意図したものではなく、またこれらに該当するものでもありません。詳細は利用規約をご覧ください。