
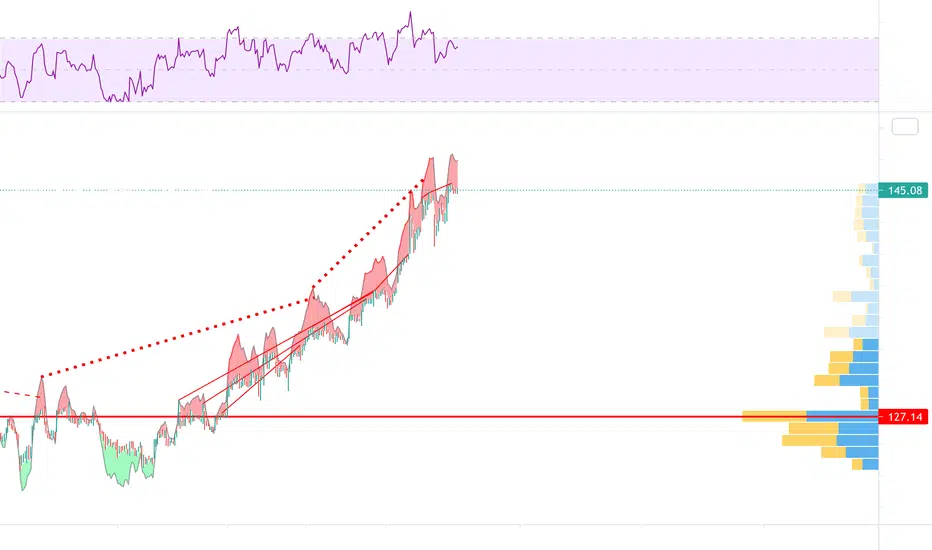
I am a huge fan of Apple and their business model, but this is technical analysis and the "red" flags are screaming that it is time for a sharp correction.
Indicators:
I. Red trend lines signaling future decline ( trend lines are from the Knoxville Divergence indicator and help foresee growing divergence often times ahead of MACD and traditional sell signals
II. High RSi shows that Apple is extremely overbought
III. Visible range shows the prime trading activity price is 127.14
IV. Divergence+ shows a red cloud above the most recent candles indicating high levels of bearish divergence
Feedback:
Let me know your thoughts in the comments below, this analysis has been used previously and is extremely accurate.
Previous analysis linked below
Indicators:
I. Red trend lines signaling future decline ( trend lines are from the Knoxville Divergence indicator and help foresee growing divergence often times ahead of MACD and traditional sell signals
II. High RSi shows that Apple is extremely overbought
III. Visible range shows the prime trading activity price is 127.14
IV. Divergence+ shows a red cloud above the most recent candles indicating high levels of bearish divergence
Feedback:
Let me know your thoughts in the comments below, this analysis has been used previously and is extremely accurate.
Previous analysis linked below
ノート
Please view my latest analysis that also supports this claim that Apple will have a higher low before hitting new highs into earningsノート
Maybe I'll use the profits from this $139 put & then buy calls after. This is a too good to be true scenario but if it happens, I will be sharing the joy with everyone in the form of cheers. :)

関連の投稿
免責事項
これらの情報および投稿は、TradingViewが提供または承認する金融、投資、取引、またはその他の種類の助言もしくは推奨であることを意図したものではなく、またこれらに該当するものでもありません。詳細は利用規約をご覧ください。
免責事項
これらの情報および投稿は、TradingViewが提供または承認する金融、投資、取引、またはその他の種類の助言もしくは推奨であることを意図したものではなく、またこれらに該当するものでもありません。詳細は利用規約をご覧ください。