
My dear followers,
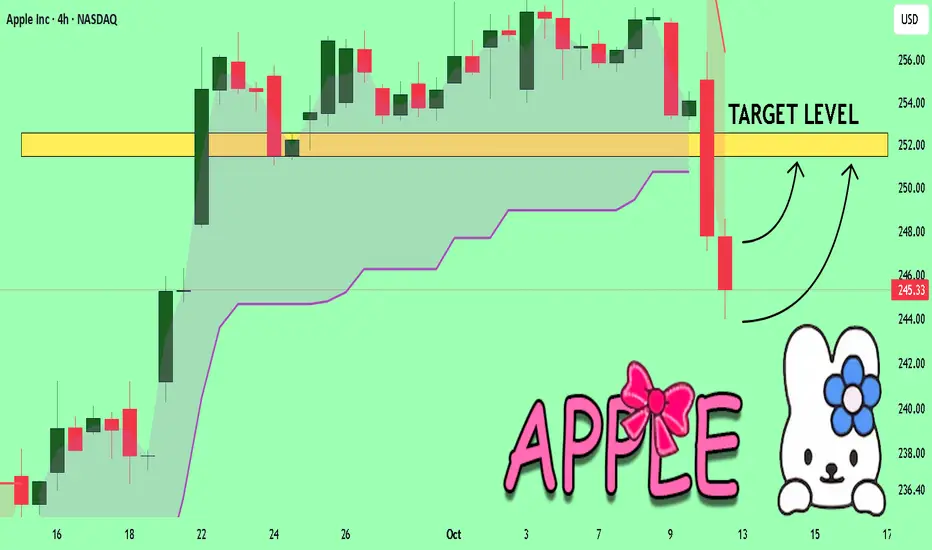
I analysed this chart on APPLE and concluded the following:
The market is trading on 245.33 pivot level.
Bias - Bullish
Technical Indicators: Both Super Trend & Pivot HL indicate a highly probable Bullish continuation.
Target - 251.49
About Used Indicators:
A super-trend indicator is plotted on either above or below the closing price to signal a buy or sell. The indicator changes color, based on whether or not you should be buying. If the super-trend indicator moves below the closing price, the indicator turns green, and it signals an entry point or points to buy.
Disclosure: I am part of Trade Nation's Influencer program and receive a monthly fee for using their TradingView charts in my analysis.
———————————
WISH YOU ALL LUCK
トレード稼働中
Awesome idea and already in the money!トレード終了: 利益確定目標に到達
Rejoice, for the target was hit!

❤️TraderGirl Free Telegrm:
t.me/anabelsignals
💁🏼♀️Say hi to me in telegram:
t.me/anabelsignalscontact
t.me/anabelsignals
💁🏼♀️Say hi to me in telegram:
t.me/anabelsignalscontact
関連の投稿
免責事項
これらの情報および投稿は、TradingViewが提供または承認する金融、投資、取引、またはその他の種類の助言もしくは推奨であることを意図したものではなく、またこれらに該当するものでもありません。詳細は利用規約をご覧ください。