
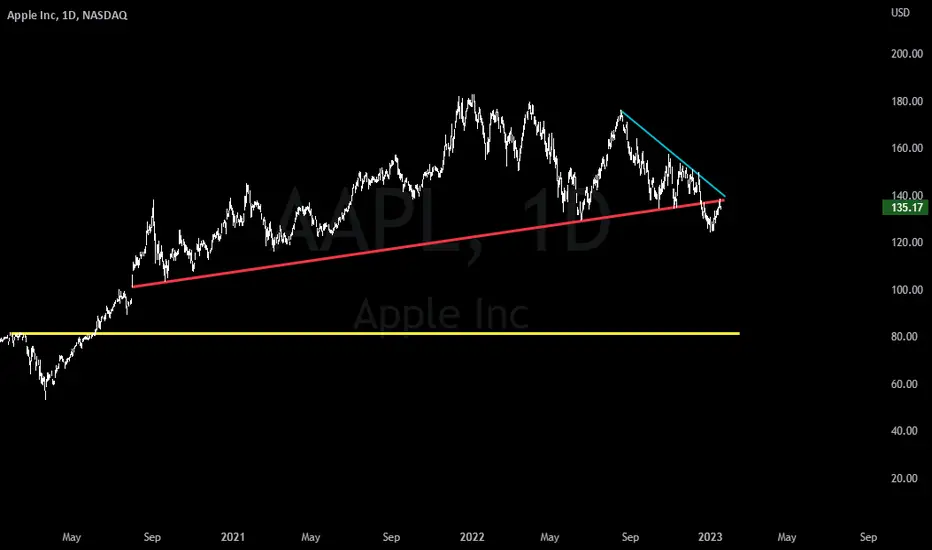
Here we are looking at AAPL on the Daily TF…
In this chart, AAPL is testing a crucial zone as resistance, which acted as previous macro support dating back to September of 2020.
As you can see, there is also a downwards sloping resistance forming as well, which it’s testing as well.
In testing its previous macro support as newfound resistance (red) and local resistance (light blue) simultaneously, we can conclude that this test for AAPL is crucial in determining what comes next…
I will continue to develop this test of resistance as the chart develops, and update the idea once it breaks in either direction!
What do you think will happen?
Cheers!

Get trade alerts with exact entries and exits + daily videos with deep dive technical analysis on stocks, crypto, commodities and options. Find these at VerifiedInvesting.com
免責事項
これらの情報および投稿は、TradingViewが提供または承認する金融、投資、取引、またはその他の種類の助言もしくは推奨であることを意図したものではなく、またこれらに該当するものでもありません。詳細は利用規約をご覧ください。
Get trade alerts with exact entries and exits + daily videos with deep dive technical analysis on stocks, crypto, commodities and options. Find these at VerifiedInvesting.com
免責事項
これらの情報および投稿は、TradingViewが提供または承認する金融、投資、取引、またはその他の種類の助言もしくは推奨であることを意図したものではなく、またこれらに該当するものでもありません。詳細は利用規約をご覧ください。