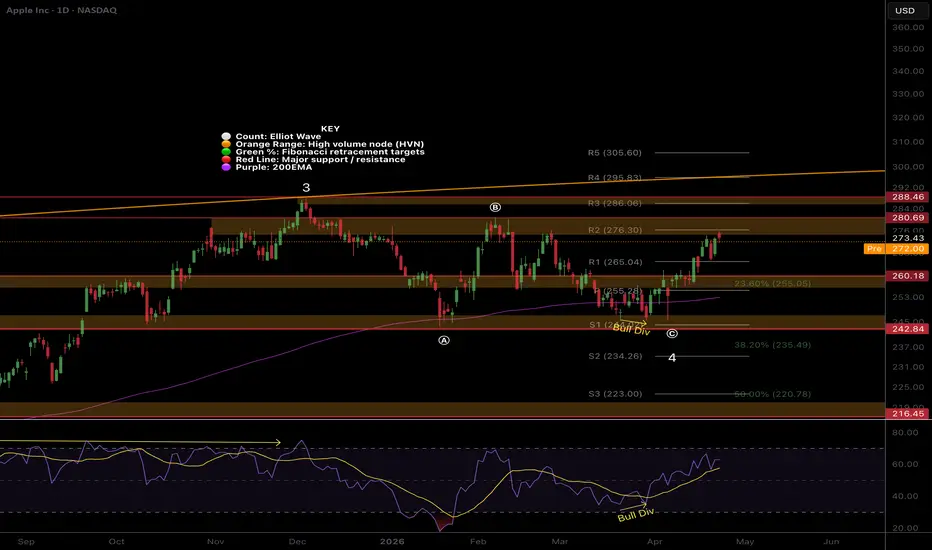
 AAPL tested the rising daily 200EMA twice and recovered the daily pivot, showing bulls in control locally. The structure is ambiguous as there is only 1 higher-high and lower-low so far. The triangle structure could also be forming a flat correction, which would be expected to have a push slightly below wave (a), completing wave 4, before pressing to new ATHs. Price is in a major resistance HVN, which is expected to be tested 3+ times before breaking.
📈 Daily RSI printed a bullish divergence, and price reacted strongly
👉 Triangle Analysis is invalidated if price breaks above wave (B), suggesting ATH incoming. While a pop below © and (A) keeps the bearish trend alive with a downside target of $238 at the 0.382 Fibs.
Safe trading

🎓 Behavioural Economist (PhD)
📈 Trader / Investor 15 years
👑 Unlock my trading plans: tradingblueprints.substack.com
🏆 Market Psychologist Newsletter: marketpsychologist.substack.com
📈 Trader / Investor 15 years
👑 Unlock my trading plans: tradingblueprints.substack.com
🏆 Market Psychologist Newsletter: marketpsychologist.substack.com
関連の投稿
免責事項
これらの情報および投稿は、TradingViewが提供または承認する金融、投資、取引、またはその他の種類の助言もしくは推奨であることを意図したものではなく、またこれらに該当するものでもありません。詳細は利用規約をご覧ください。
🎓 Behavioural Economist (PhD)
📈 Trader / Investor 15 years
👑 Unlock my trading plans: tradingblueprints.substack.com
🏆 Market Psychologist Newsletter: marketpsychologist.substack.com
📈 Trader / Investor 15 years
👑 Unlock my trading plans: tradingblueprints.substack.com
🏆 Market Psychologist Newsletter: marketpsychologist.substack.com
関連の投稿
免責事項
これらの情報および投稿は、TradingViewが提供または承認する金融、投資、取引、またはその他の種類の助言もしくは推奨であることを意図したものではなく、またこれらに該当するものでもありません。詳細は利用規約をご覧ください。