
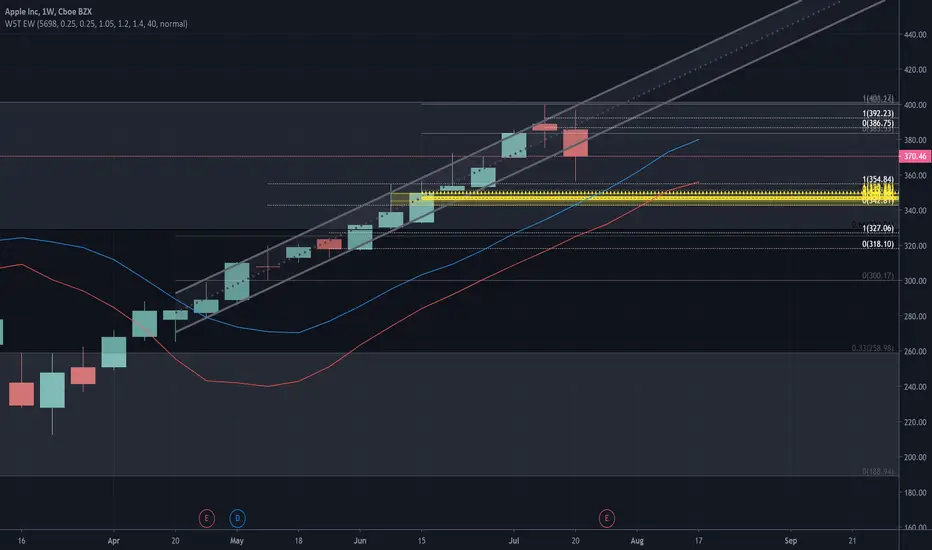
Spent some time rethinking how I can markup the chart on multiple time frames. Avoiding Red and Green for bias, since old supply can become new demandn and vice versa. The goal was to minimize number of colors I need and relly on line style and weight. And utilizing higlight shades for key areas of interests.
I hope others can find this useful.
I hope others can find this useful.

免責事項
これらの情報および投稿は、TradingViewが提供または承認する金融、投資、取引、またはその他の種類の助言もしくは推奨であることを意図したものではなく、またこれらに該当するものでもありません。詳細は利用規約をご覧ください。
免責事項
これらの情報および投稿は、TradingViewが提供または承認する金融、投資、取引、またはその他の種類の助言もしくは推奨であることを意図したものではなく、またこれらに該当するものでもありません。詳細は利用規約をご覧ください。