
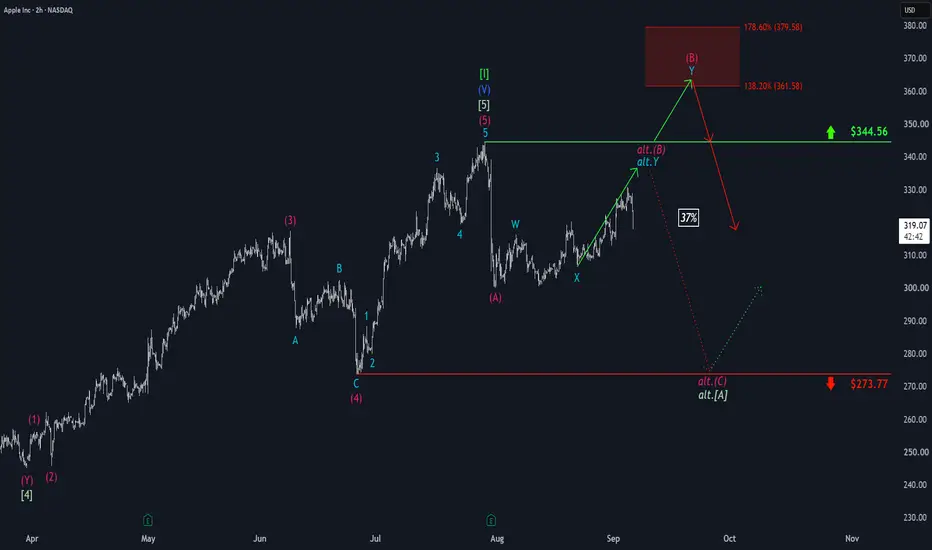
Since the cycle top at $344.56, we see AAPL in a long-term correction, with an (excessive) counter-move to the upside still expected to complete soon. We anticipate the corresponding top at new all-time highs above $344.56—specifically, within our red Target Zone ($361.58–$379.58). At that point, price should ultimately reverse lower. In our alternative scenario, AAPL would complete the counter-move below resistance at $344.56 (probability: 37%). After that top, we would expect sell-offs down toward the $273.77 support level. In this case, our red Target Zone ($361.58–$379.58) would no longer apply.

📊 Daily market insights combining macro + Elliott Wave analysis
🚀 Spot trends early with momentum, sentiment & price structure
🌐 Join thousands trading smarter at hkcmglobal.com
🚀 Spot trends early with momentum, sentiment & price structure
🌐 Join thousands trading smarter at hkcmglobal.com
関連の投稿
免責事項
これらの情報および投稿は、TradingViewが提供または承認する金融、投資、取引、またはその他の種類の助言もしくは推奨であることを意図したものではなく、またこれらに該当するものでもありません。詳細は利用規約をご覧ください。
📊 Daily market insights combining macro + Elliott Wave analysis
🚀 Spot trends early with momentum, sentiment & price structure
🌐 Join thousands trading smarter at hkcmglobal.com
🚀 Spot trends early with momentum, sentiment & price structure
🌐 Join thousands trading smarter at hkcmglobal.com
関連の投稿
免責事項
これらの情報および投稿は、TradingViewが提供または承認する金融、投資、取引、またはその他の種類の助言もしくは推奨であることを意図したものではなく、またこれらに該当するものでもありません。詳細は利用規約をご覧ください。