
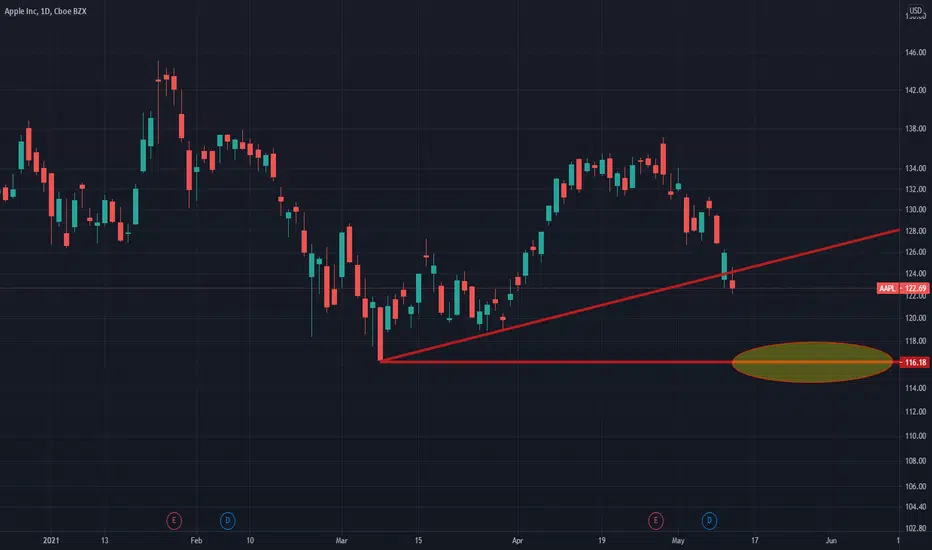
Those who have early access to my trading ideas have the chance to perform better.
Don't you believe it?
Check my recently private post:

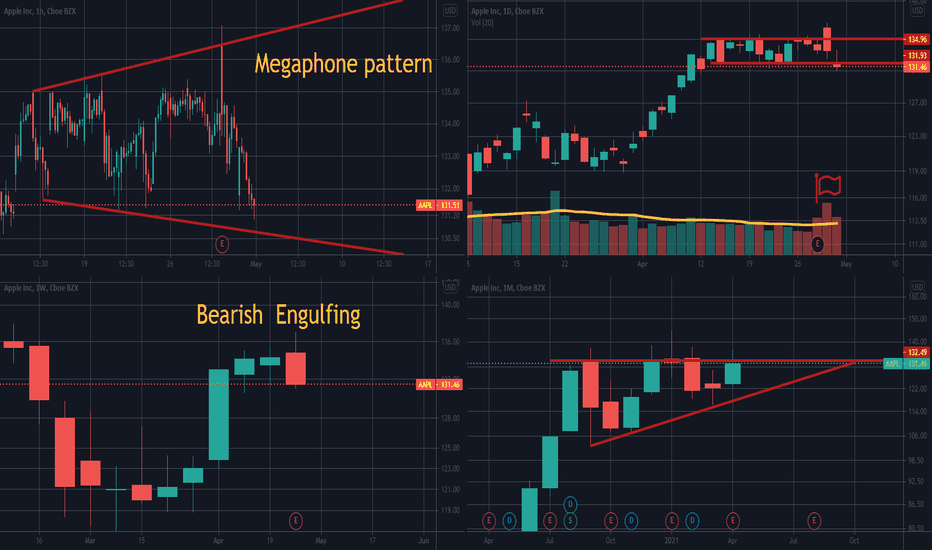
Hourly Chart: Lower border of Megaphone, should be supported around 130. (Neutral)
Daily Chart: Lowest close since April 12, close below daily open in the last 5 trading sessions, and increased volume above monthly average while the price fails to close above daily open is in favor of bearish case! (Bearish)
Weekly Chart: Bearish engulfing after 2 Doji candles. (Bearish)
Monthly Chart: Failure to close above 132.49 in the last 4 months, which means Apple's return in 2021 is slightly negative so far! (Neutral)
Change in Average Dollar Value of Trades: -18% in the first 4 months of 2021 in comparison to the last 4 months of 2020. (Bearish)
Conclusion: Neutral-Bearish in May is the most probable scenario.
Educational Article:
1- Megaphone or Broadening Pattern:
investopedia.com/terms/b/broadeningformation.asp
2-Bearish Engulfing:
investopedia.com/terms/b/bearishengulfingp.asp
3-Resistance:
investopedia.com/terms/r/resistance.asp
4- Multi-timeframe Analysis:
investopedia.com/articles/trading/07/timeframes.asp
5-Dollar volume:
investopedia.com/terms/d/dollar-volume-liquidity.asp
If you are interested to have early access to my trading ideas, check the signature box below the post for more information.
Don't you believe it?
Check my recently private post:
Hourly Chart: Lower border of Megaphone, should be supported around 130. (Neutral)
Daily Chart: Lowest close since April 12, close below daily open in the last 5 trading sessions, and increased volume above monthly average while the price fails to close above daily open is in favor of bearish case! (Bearish)
Weekly Chart: Bearish engulfing after 2 Doji candles. (Bearish)
Monthly Chart: Failure to close above 132.49 in the last 4 months, which means Apple's return in 2021 is slightly negative so far! (Neutral)
Change in Average Dollar Value of Trades: -18% in the first 4 months of 2021 in comparison to the last 4 months of 2020. (Bearish)
Conclusion: Neutral-Bearish in May is the most probable scenario.
Educational Article:
1- Megaphone or Broadening Pattern:
investopedia.com/terms/b/broadeningformation.asp
2-Bearish Engulfing:
investopedia.com/terms/b/bearishengulfingp.asp
3-Resistance:
investopedia.com/terms/r/resistance.asp
4- Multi-timeframe Analysis:
investopedia.com/articles/trading/07/timeframes.asp
5-Dollar volume:
investopedia.com/terms/d/dollar-volume-liquidity.asp
If you are interested to have early access to my trading ideas, check the signature box below the post for more information.

Use the following link to access trading ideas: patreon.com/SniperTraderStocks?utm_medium=unknown&utm_source=join_link&utm_campaign=creatorshare_creator&utm_content=copyLink
免責事項
これらの情報および投稿は、TradingViewが提供または承認する金融、投資、取引、またはその他の種類の助言もしくは推奨であることを意図したものではなく、またこれらに該当するものでもありません。詳細は利用規約をご覧ください。
Use the following link to access trading ideas: patreon.com/SniperTraderStocks?utm_medium=unknown&utm_source=join_link&utm_campaign=creatorshare_creator&utm_content=copyLink
免責事項
これらの情報および投稿は、TradingViewが提供または承認する金融、投資、取引、またはその他の種類の助言もしくは推奨であることを意図したものではなく、またこれらに該当するものでもありません。詳細は利用規約をご覧ください。