
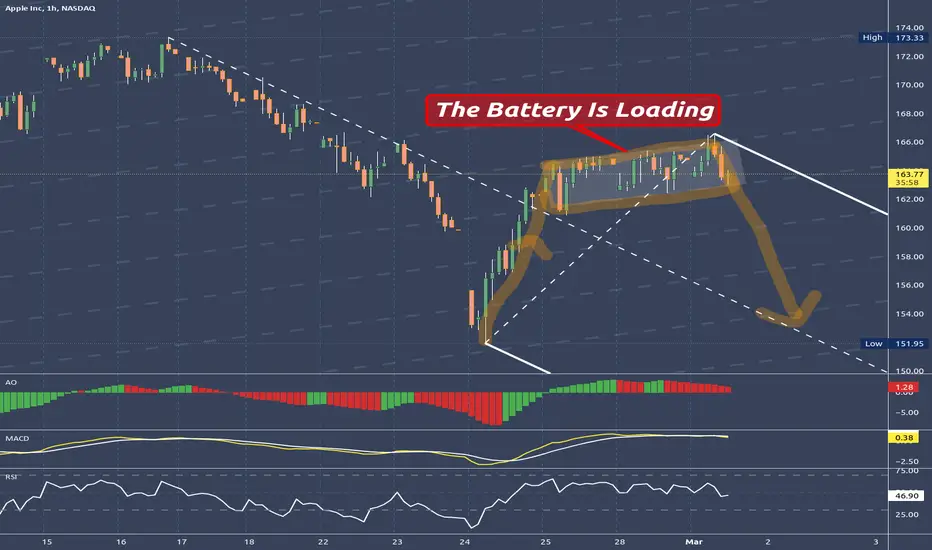
...and the unloading is near.
The dashed line just shows the frequency of Apple.
The white pitchfork shows the most probable path of price. The right leg down (orange) is about the same as the leg up.
If the down leg plays out, we will see price at least on the centerline of the white pitchfork.
I think this sideways trading has it's reason.
We will see soon.
BTW: I'm loaded too... §8-)
The dashed line just shows the frequency of Apple.
The white pitchfork shows the most probable path of price. The right leg down (orange) is about the same as the leg up.
If the down leg plays out, we will see price at least on the centerline of the white pitchfork.
I think this sideways trading has it's reason.
We will see soon.
BTW: I'm loaded too... §8-)
ノート
Shifting the pitchfork to the new C point.This is, because the Battery is loading even more.
ノート
ノート
Centerline OK4You? §8-)ノート
Until there is a open and close above the U-MLH, the target is the CL.
Remove subjective trading:
👉 Andrews Pitchforks applied by fixed rules
👉 Weekly structure maps for Indices, Futures, Energy and Crypto, plus the method behind them.
→ alphametrics.substack.com/?utm_source=tradingview
👉 Andrews Pitchforks applied by fixed rules
👉 Weekly structure maps for Indices, Futures, Energy and Crypto, plus the method behind them.
→ alphametrics.substack.com/?utm_source=tradingview
免責事項
これらの情報および投稿は、TradingViewが提供または承認する金融、投資、取引、またはその他の種類の助言もしくは推奨であることを意図したものではなく、またこれらに該当するものでもありません。詳細は利用規約をご覧ください。
Remove subjective trading:
👉 Andrews Pitchforks applied by fixed rules
👉 Weekly structure maps for Indices, Futures, Energy and Crypto, plus the method behind them.
→ alphametrics.substack.com/?utm_source=tradingview
👉 Andrews Pitchforks applied by fixed rules
👉 Weekly structure maps for Indices, Futures, Energy and Crypto, plus the method behind them.
→ alphametrics.substack.com/?utm_source=tradingview
免責事項
これらの情報および投稿は、TradingViewが提供または承認する金融、投資、取引、またはその他の種類の助言もしくは推奨であることを意図したものではなく、またこれらに該当するものでもありません。詳細は利用規約をご覧ください。