
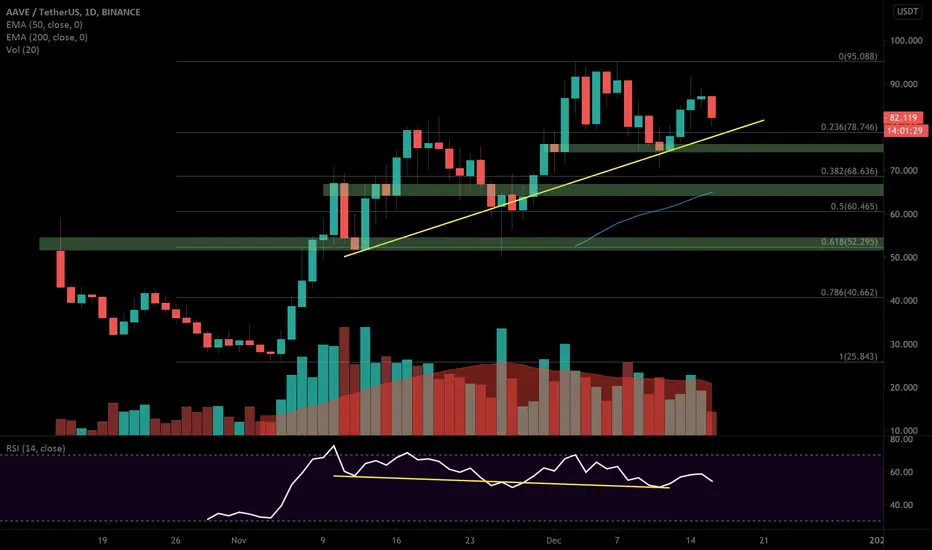
AAVE/USDT looks very weak right now on the daily chart. Strong RSI divergence (yellow lines) shows uptrend has been losing momentum since the peak on November 10 and if today's candle closes in the red it'll be the first lower high on the chart since that explosive rally that started on November 5th.
There are a couple of order block supports (top two green bars) and the 50 EMA (blue) that I think will see some action on the way down. Expecting prices to depress right down to the 0.618 Fibonacci level around $53 though before we see a significant push back from bullish traders.
No timeline for this, just going to wait and see how this unfolds.

免責事項
これらの情報および投稿は、TradingViewが提供または承認する金融、投資、取引、またはその他の種類の助言もしくは推奨であることを意図したものではなく、またこれらに該当するものでもありません。詳細は利用規約をご覧ください。
免責事項
これらの情報および投稿は、TradingViewが提供または承認する金融、投資、取引、またはその他の種類の助言もしくは推奨であることを意図したものではなく、またこれらに該当するものでもありません。詳細は利用規約をご覧ください。