
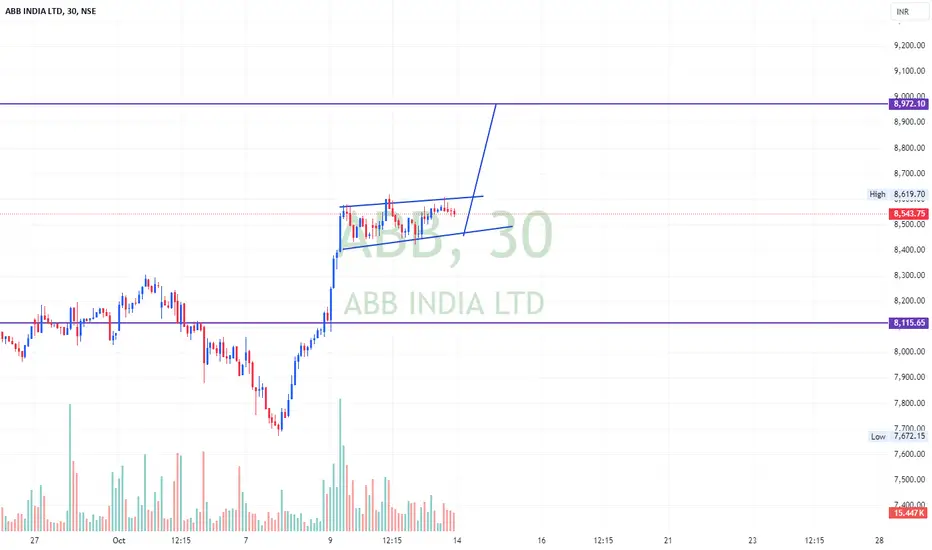
The chart shows a strong upward trend in ABB India Ltd, with a recent consolidation forming a rising wedge pattern. This pattern typically indicates a potential breakout. The price is currently testing the upper boundary of the wedge, suggesting a possible bullish breakout if it surpasses the resistance level around 8,619.70 INR.
Key Levels:
Resistance: 8,972.10 INR
Support: 8,115.65 INR
Potential Trade Idea:
Bullish Scenario: A breakout above 8,619.70 INR could lead to a rally towards the next resistance at 8,972.10 INR.
Bearish Scenario: If the price fails to break out and falls below the wedge, watch for support at 8,115.65 INR.
Key Levels:
Resistance: 8,972.10 INR
Support: 8,115.65 INR
Potential Trade Idea:
Bullish Scenario: A breakout above 8,619.70 INR could lead to a rally towards the next resistance at 8,972.10 INR.
Bearish Scenario: If the price fails to break out and falls below the wedge, watch for support at 8,115.65 INR.

免責事項
これらの情報および投稿は、TradingViewが提供または承認する金融、投資、取引、またはその他の種類の助言もしくは推奨であることを意図したものではなく、またこれらに該当するものでもありません。詳細は利用規約をご覧ください。
免責事項
これらの情報および投稿は、TradingViewが提供または承認する金融、投資、取引、またはその他の種類の助言もしくは推奨であることを意図したものではなく、またこれらに該当するものでもありません。詳細は利用規約をご覧ください。