
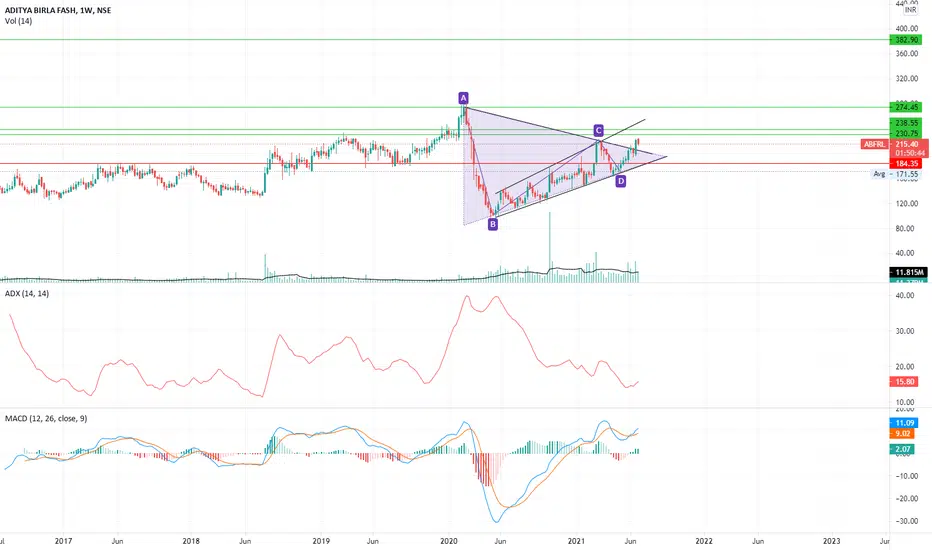
A Symmetric Triangle formation has occurred on the weekly charts.
Above average high volume on breakout.
Also price has been in an expanding formation since 11th May 2020.
Price objective as per Triangle formation comes to 382.9
Other near term price targets are shown by green horizontal lines
Rising ADX line + Bullish MACD crossover on weekly charts further confirm the bullish trend
Stop Loss can be kept at 184.3
Risk/Reward Ratio is 4.35
Above average high volume on breakout.
Also price has been in an expanding formation since 11th May 2020.
Price objective as per Triangle formation comes to 382.9
Other near term price targets are shown by green horizontal lines
Rising ADX line + Bullish MACD crossover on weekly charts further confirm the bullish trend
Stop Loss can be kept at 184.3
Risk/Reward Ratio is 4.35

免責事項
これらの情報および投稿は、TradingViewが提供または承認する金融、投資、取引、またはその他の種類の助言もしくは推奨であることを意図したものではなく、またこれらに該当するものでもありません。詳細は利用規約をご覧ください。
免責事項
これらの情報および投稿は、TradingViewが提供または承認する金融、投資、取引、またはその他の種類の助言もしくは推奨であることを意図したものではなく、またこれらに該当するものでもありません。詳細は利用規約をご覧ください。