 ABNB — Watching This Setup
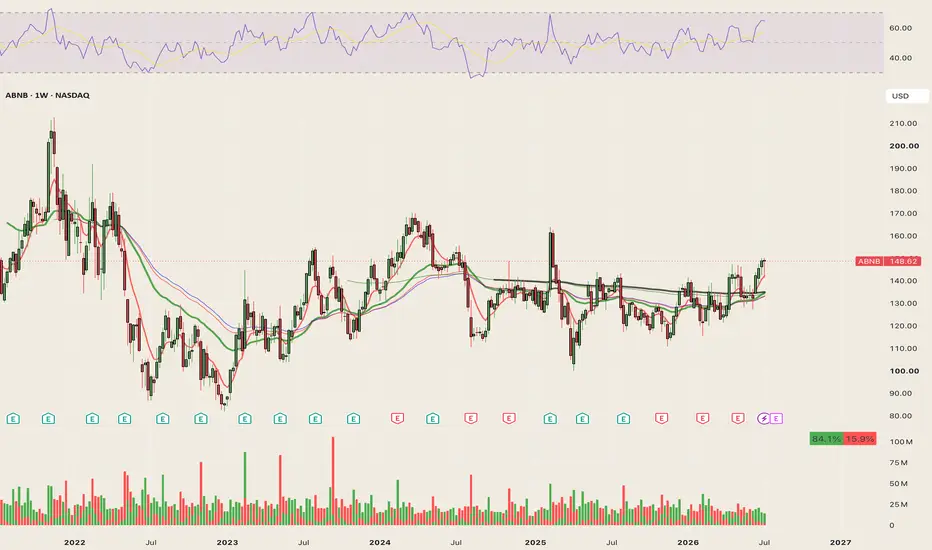
Weekly chart, price reclaiming $148.62 after a two-year range.
- Broke down from ~$170 in 2022, bottomed near $85 in early 2023
- Spent 2024–2026 chopping in a $110–$140 range
- Just pushed above that range on rising volume
Why this matters. A multi-year range breakout is one of the cleanest technical signals — it means supply that capped price for two years just got absorbed. Doesn't confirm a trend by itself, but it's the first sign to take seriously.
What we're watching. Does price hold above the old range (~$140) on a pullback, or is this a fakeout back into the chop? That retest is the tell, not this breakout candle.
Status: watchlist only. No position. No structure picked yet. This is chart study, not a trade call.
*Educational content, not financial advice.*

免責事項
これらの情報および投稿は、TradingViewが提供または承認する金融、投資、取引、またはその他の種類の助言もしくは推奨であることを意図したものではなく、またこれらに該当するものでもありません。詳細は利用規約をご覧ください。
免責事項
これらの情報および投稿は、TradingViewが提供または承認する金融、投資、取引、またはその他の種類の助言もしくは推奨であることを意図したものではなく、またこれらに該当するものでもありません。詳細は利用規約をご覧ください。