
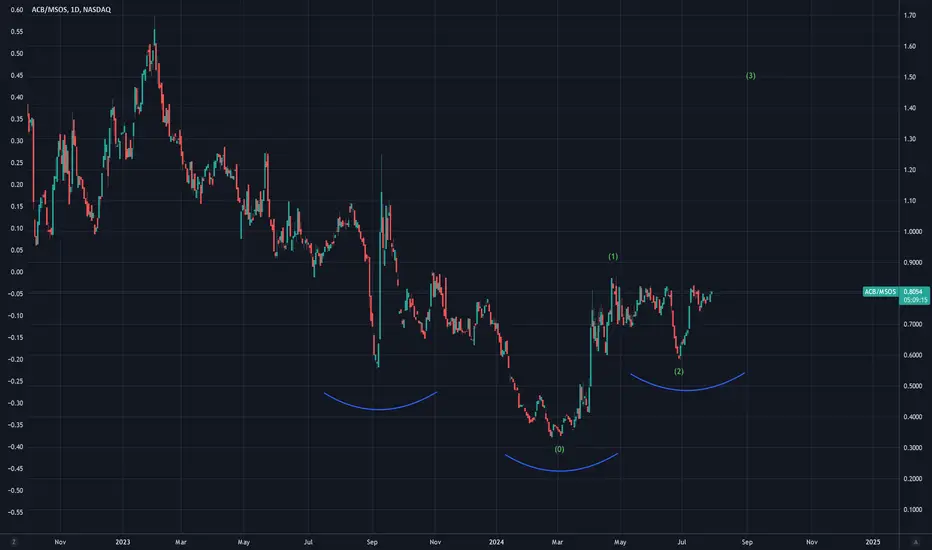
ACB chart itself looks bullish, but the ACB/MSOS spread shows a cleaner set of waves to predict the movement.
Buy ACB as long as it is more bullish than MSOS. This thinking applies to any stock compared to a related ETF or index.
Buy ACB as long as it is more bullish than MSOS. This thinking applies to any stock compared to a related ETF or index.
ノート
MSOS great recovery off the recession worry lows yesterday. Still a long way but moving up in the same direction to 1.25 to 1.5x MSOS, do the math.
免責事項
これらの情報および投稿は、TradingViewが提供または承認する金融、投資、取引、またはその他の種類の助言もしくは推奨であることを意図したものではなく、またこれらに該当するものでもありません。詳細は利用規約をご覧ください。
免責事項
これらの情報および投稿は、TradingViewが提供または承認する金融、投資、取引、またはその他の種類の助言もしくは推奨であることを意図したものではなく、またこれらに該当するものでもありません。詳細は利用規約をご覧ください。