
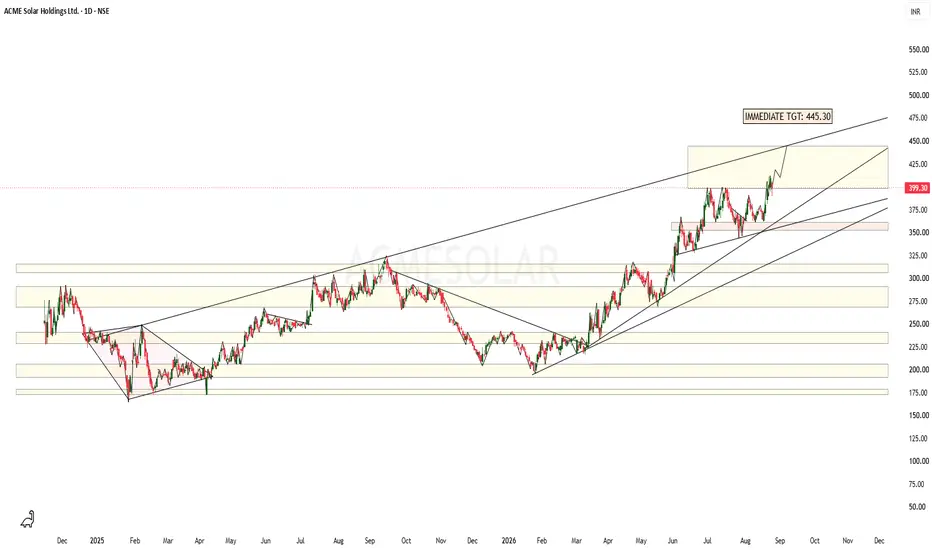
Presenting One More Chart Analysis after a Long time...
ACME SOLAR HOLDINGS LTD Chart is quite strong with Bullish View and looks promising at
CMP 399.30.
Patterns are drawn on Daily Chart and as usual complex & detailed drawing with Price Analysis is presented considering all the aspects of the chart.
Target & SL is as follows:
Tgt: 445.30
SL: 380-385 (Closing Basis)
Market is all about OPPORTUNITY / ENTRY / TIMING !!!!!
Basis some minute observations, chart analysis is made, target and SL is given to understand the core of the subject and for learning purpose only.
ACME SOLAR HOLDINGS LTD Chart is quite strong with Bullish View and looks promising at
CMP 399.30.
Patterns are drawn on Daily Chart and as usual complex & detailed drawing with Price Analysis is presented considering all the aspects of the chart.
Target & SL is as follows:
Tgt: 445.30
SL: 380-385 (Closing Basis)
Market is all about OPPORTUNITY / ENTRY / TIMING !!!!!
Basis some minute observations, chart analysis is made, target and SL is given to understand the core of the subject and for learning purpose only.

免責事項
これらの情報および投稿は、TradingViewが提供または承認する金融、投資、取引、またはその他の種類の助言もしくは推奨であることを意図したものではなく、またこれらに該当するものでもありません。詳細は利用規約をご覧ください。
免責事項
これらの情報および投稿は、TradingViewが提供または承認する金融、投資、取引、またはその他の種類の助言もしくは推奨であることを意図したものではなく、またこれらに該当するものでもありません。詳細は利用規約をご覧ください。