
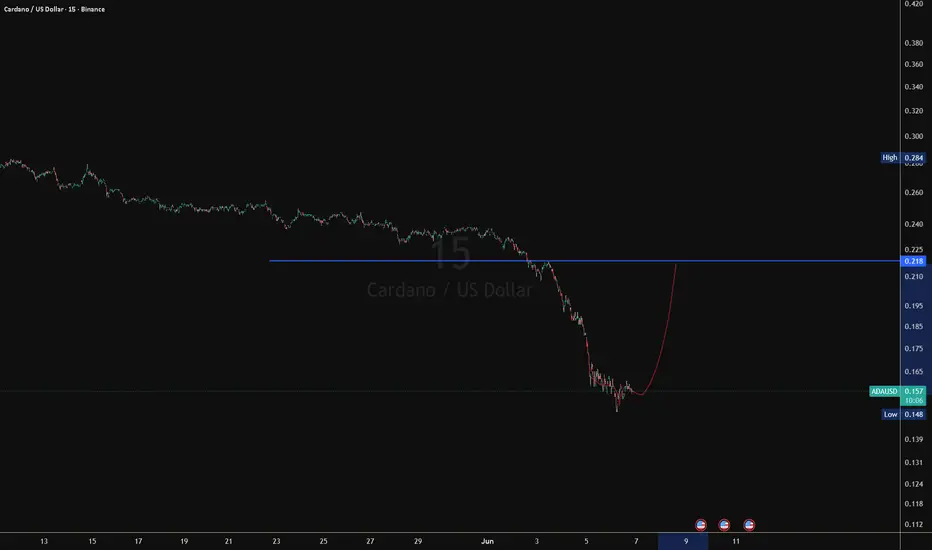
Here is what stands out on the 15-minute ADA/USDT chart
Chart Analysis: Potential Inverse Head and ShouldersFollowing a sharp, aggressive downward trend, the price is currently attempting to bottom out by forming a classic bullish reversal setup: an Inverse Head and Shoulders pattern.Breakdown of the StructureLeft Shoulder: A brief pause and stabilization point that formed in the $0.1510 - 0.1520$ zone before one final flush down.Head: The absolute capitulation low of the move, marked precisely by the blue label at 0.1486.
This drop was met with an immediate, sharp bounce back up.Right Shoulder: The price action we are seeing right now. At 0.1574, the market is carving out a vital Higher Low. This signals that sellers are losing momentum and buyers are stepping in much higher than they did at the head.
Key Levels and TargetsThe Neckline (0.1620): This is the most critical horizontal level on the chart right now. The pattern is not officially triggered until we get a clean candle close above this blue line.First Target (0.1771): A successful breakout above the neckline points directly toward the next major overhead resistance line visible at 0.1771.Major Structural Target (0.2400): If the reversal gains macro strength, the ultimate target is the 0.2400 zone, which acted as a heavy structural floor earlier on the chart before the massive sell-off.
⚠️ Quick Reality Check: Because this is an M15 (15-minute) chart, local market noise is high. It is usually safer to wait for an explicit breakout and retest of the 0.1620 level on solid volume rather than trying to front-run the right shoulder, as a drop below 0.1486 completely invalidates the pattern.
Chart Analysis: Potential Inverse Head and ShouldersFollowing a sharp, aggressive downward trend, the price is currently attempting to bottom out by forming a classic bullish reversal setup: an Inverse Head and Shoulders pattern.Breakdown of the StructureLeft Shoulder: A brief pause and stabilization point that formed in the $0.1510 - 0.1520$ zone before one final flush down.Head: The absolute capitulation low of the move, marked precisely by the blue label at 0.1486.
This drop was met with an immediate, sharp bounce back up.Right Shoulder: The price action we are seeing right now. At 0.1574, the market is carving out a vital Higher Low. This signals that sellers are losing momentum and buyers are stepping in much higher than they did at the head.
Key Levels and TargetsThe Neckline (0.1620): This is the most critical horizontal level on the chart right now. The pattern is not officially triggered until we get a clean candle close above this blue line.First Target (0.1771): A successful breakout above the neckline points directly toward the next major overhead resistance line visible at 0.1771.Major Structural Target (0.2400): If the reversal gains macro strength, the ultimate target is the 0.2400 zone, which acted as a heavy structural floor earlier on the chart before the massive sell-off.
⚠️ Quick Reality Check: Because this is an M15 (15-minute) chart, local market noise is high. It is usually safer to wait for an explicit breakout and retest of the 0.1620 level on solid volume rather than trying to front-run the right shoulder, as a drop below 0.1486 completely invalidates the pattern.
トレード稼働中
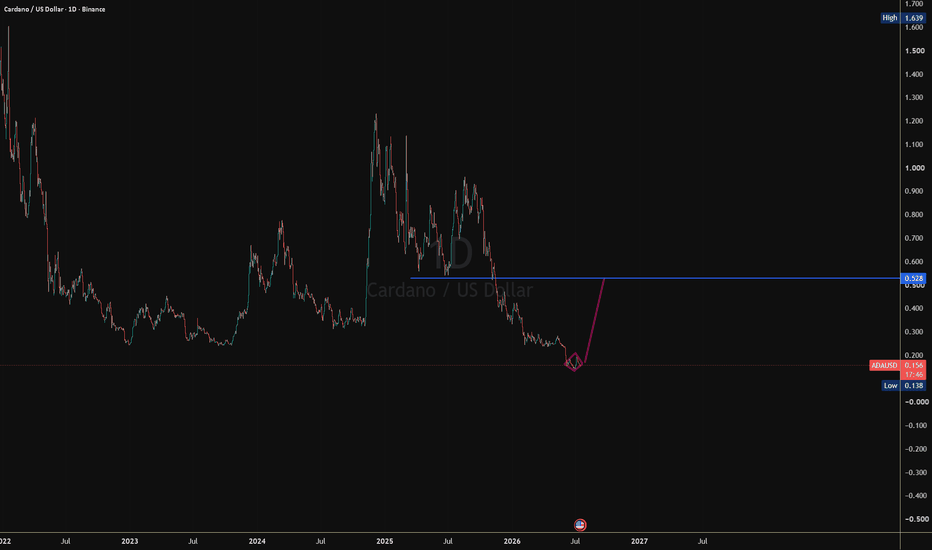
It looks more like a diamond reversal pattern. nowノート

免責事項
これらの情報および投稿は、TradingViewが提供または承認する金融、投資、取引、またはその他の種類の助言もしくは推奨であることを意図したものではなく、またこれらに該当するものでもありません。詳細は利用規約をご覧ください。
免責事項
これらの情報および投稿は、TradingViewが提供または承認する金融、投資、取引、またはその他の種類の助言もしくは推奨であることを意図したものではなく、またこれらに該当するものでもありません。詳細は利用規約をご覧ください。