
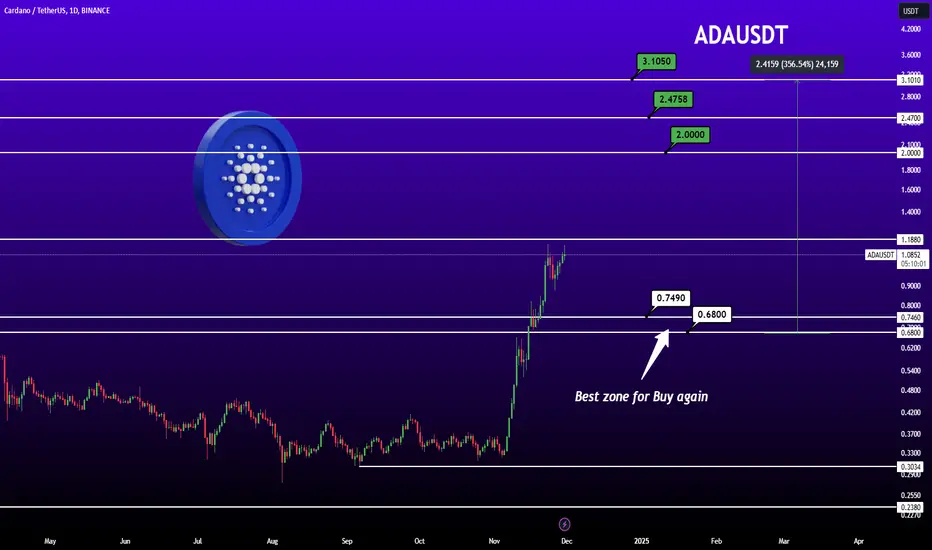
🚀 ADA/USDT Price Analysis
The Cardano (ADA) chart shows strong bullish momentum, with prices climbing steadily. Here's a breakdown of key levels:
🔼 Resistance Zones to Watch:
$2.00 🛑: First major resistance. Breaking this could signal a rally.
$2.4758 🛑: A critical level for medium-term targets.
$3.1050 🛑: Long-term price target if the bullish trend holds.
🔽 Support Zones for Buying:
$0.7490 ✅: A solid support zone where buyers previously stepped in.
$0.6800 ✅: Highlighted as the "Best Zone for Buy Again" – ideal for re-entry during corrections.
📈 Upside Potential:
If the bullish trend continues, ADA has a 356% growth potential, aiming for $2.4159 and beyond!
💡 Takeaway:
The current trend favors bulls, but a pullback to support zones could provide better entry opportunities. Keep an eye on trading volumes and breakout confirmations at resistance levels!

関連の投稿
免責事項
これらの情報および投稿は、TradingViewが提供または承認する金融、投資、取引、またはその他の種類の助言もしくは推奨であることを意図したものではなく、またこれらに該当するものでもありません。詳細は利用規約をご覧ください。
免責事項
これらの情報および投稿は、TradingViewが提供または承認する金融、投資、取引、またはその他の種類の助言もしくは推奨であることを意図したものではなく、またこれらに該当するものでもありません。詳細は利用規約をご覧ください。