
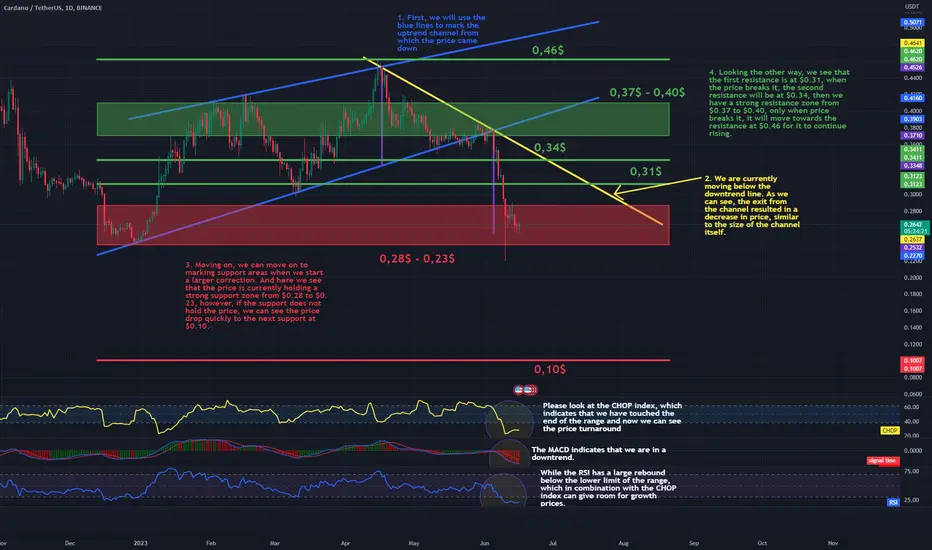
Hello everyone, I invite you to review the ADA chart in pair to USDT, on a one-day interval. First of all, we will use the blue lines to mark the uptrend channel from which the price has gone down and we are currently moving below the downtrend line. As we can see, the exit from the channel resulted in a decrease in price, similar to the size of the channel itself.
Moving on, we can move on to marking support areas when we start a larger correction. And here we see that the price is currently holding a strong support zone from $0.28 to $0.23, however, if the support does not hold the price, we can see the price drop quickly to the next support at $0.10.
Looking the other way, we see that the first resistance is at $0.31, when the price breaks it, the second resistance will be at $0.34, then we have a strong resistance zone from $0.37 to $0.40, only when price breaks it, it will move towards the resistance at $0.46 for it to continue rising.
Please look at the CHOP index, which indicates that we have touched the end of the range and now we can see the price turnaround, the MACD indicates that we are in a downtrend, while the RSI has a large rebound below the lower limit of the range, which in combination with the CHOP index can give room for growth prices.
Moving on, we can move on to marking support areas when we start a larger correction. And here we see that the price is currently holding a strong support zone from $0.28 to $0.23, however, if the support does not hold the price, we can see the price drop quickly to the next support at $0.10.
Looking the other way, we see that the first resistance is at $0.31, when the price breaks it, the second resistance will be at $0.34, then we have a strong resistance zone from $0.37 to $0.40, only when price breaks it, it will move towards the resistance at $0.46 for it to continue rising.
Please look at the CHOP index, which indicates that we have touched the end of the range and now we can see the price turnaround, the MACD indicates that we are in a downtrend, while the RSI has a large rebound below the lower limit of the range, which in combination with the CHOP index can give room for growth prices.

免責事項
これらの情報および投稿は、TradingViewが提供または承認する金融、投資、取引、またはその他の種類の助言もしくは推奨であることを意図したものではなく、またこれらに該当するものでもありません。詳細は利用規約をご覧ください。
免責事項
これらの情報および投稿は、TradingViewが提供または承認する金融、投資、取引、またはその他の種類の助言もしくは推奨であることを意図したものではなく、またこれらに該当するものでもありません。詳細は利用規約をご覧ください。