
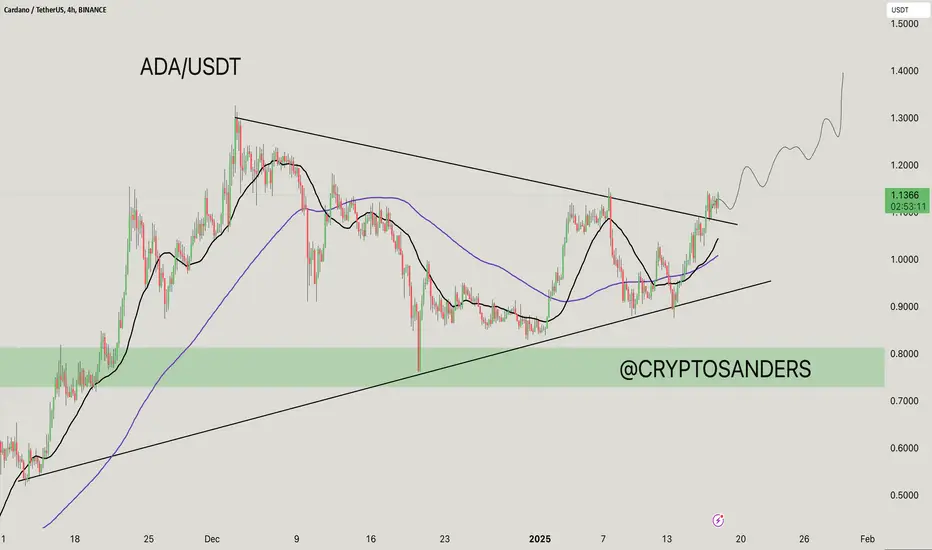
ADA/USDT 4-hour chart shows a bullish continuation pattern as Cardano prepares for a potential breakout after a period of consolidation.
The price is making higher lows, indicated by the rising trendline.
Resistance lies at $1.20, which aligns with the upper boundary of the triangle.
Support: $0.80–$0.90 (green area and trendline).
Resistance: $1.20 (key breakout level).
The 21-day MA and 100-day MA are sloping upwards, indicating bullish momentum.
The price is currently above both MAs, which provide additional support.
If ADA breaks above $1.20, it could head towards $1.50 or higher.
However, a breakdown below the rising trendline could lead to a retest of $0.80.
This setup suggests that ADA is gaining strength, with bullish continuation likely on the breakout.
If you found this analysis helpful, hit the Like button and share your thoughts or questions in the comments below. Your feedback matters!
Thanks for your support!
DYOR. NFA
The price is making higher lows, indicated by the rising trendline.
Resistance lies at $1.20, which aligns with the upper boundary of the triangle.
Support: $0.80–$0.90 (green area and trendline).
Resistance: $1.20 (key breakout level).
The 21-day MA and 100-day MA are sloping upwards, indicating bullish momentum.
The price is currently above both MAs, which provide additional support.
If ADA breaks above $1.20, it could head towards $1.50 or higher.
However, a breakdown below the rising trendline could lead to a retest of $0.80.
This setup suggests that ADA is gaining strength, with bullish continuation likely on the breakout.
If you found this analysis helpful, hit the Like button and share your thoughts or questions in the comments below. Your feedback matters!
Thanks for your support!
DYOR. NFA

関連の投稿
免責事項
これらの情報および投稿は、TradingViewが提供または承認する金融、投資、取引、またはその他の種類の助言もしくは推奨であることを意図したものではなく、またこれらに該当するものでもありません。詳細は利用規約をご覧ください。
関連の投稿
免責事項
これらの情報および投稿は、TradingViewが提供または承認する金融、投資、取引、またはその他の種類の助言もしくは推奨であることを意図したものではなく、またこれらに該当するものでもありません。詳細は利用規約をご覧ください。