
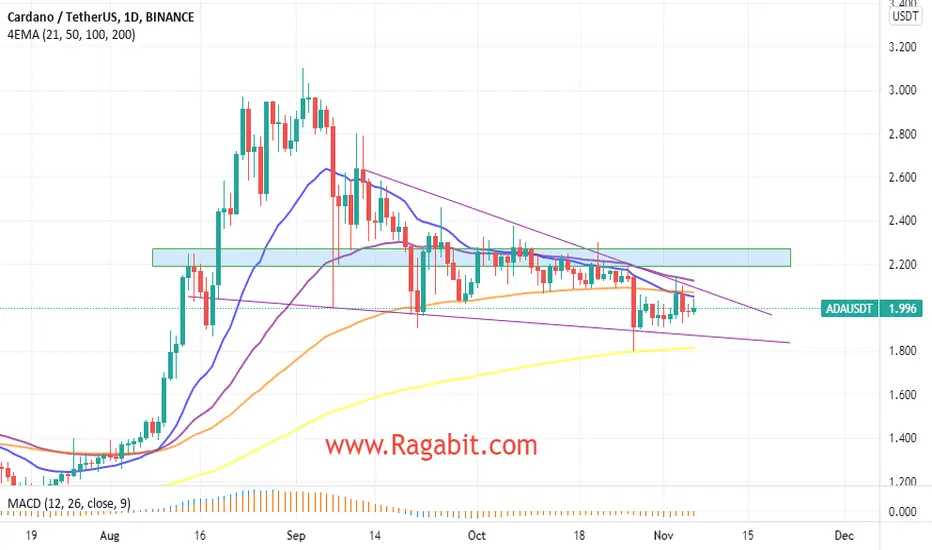
ADA/USDT (D1)
Price can be seen forming a falling wedge pattern and approaching a support zone starting from $1.884 to $1.750 where W1 21 EMA alongwith D1 200 EMA are acting as good supports.
Currently we can see D1 50 21 and 100 EMAs acting as strong resistances aligning very well with the trendline resistance of the falling wedge which is not a very good sign. A bullish scenario for the price could be flipping the resistance zone starting from $2.150 to $2.320 and holding above it before moving upwards to the next resistance at around the $2.67 level where the ATH resistance also starts.
We've to wait for price for a clear move wheather downwards or upwards as currently it is not in a very good state. It still has a strong resistance zone to break through for a bullish scenario.
Price can be seen forming a falling wedge pattern and approaching a support zone starting from $1.884 to $1.750 where W1 21 EMA alongwith D1 200 EMA are acting as good supports.
Currently we can see D1 50 21 and 100 EMAs acting as strong resistances aligning very well with the trendline resistance of the falling wedge which is not a very good sign. A bullish scenario for the price could be flipping the resistance zone starting from $2.150 to $2.320 and holding above it before moving upwards to the next resistance at around the $2.67 level where the ATH resistance also starts.
We've to wait for price for a clear move wheather downwards or upwards as currently it is not in a very good state. It still has a strong resistance zone to break through for a bullish scenario.

免責事項
これらの情報および投稿は、TradingViewが提供または承認する金融、投資、取引、またはその他の種類の助言もしくは推奨であることを意図したものではなく、またこれらに該当するものでもありません。詳細は利用規約をご覧ください。
免責事項
これらの情報および投稿は、TradingViewが提供または承認する金融、投資、取引、またはその他の種類の助言もしくは推奨であることを意図したものではなく、またこれらに該当するものでもありません。詳細は利用規約をご覧ください。