
Hello, everyone!
Yesterday we considered the ultimate divergences guide. Today it is time to practice! I found the very strong long signal on Cardano.
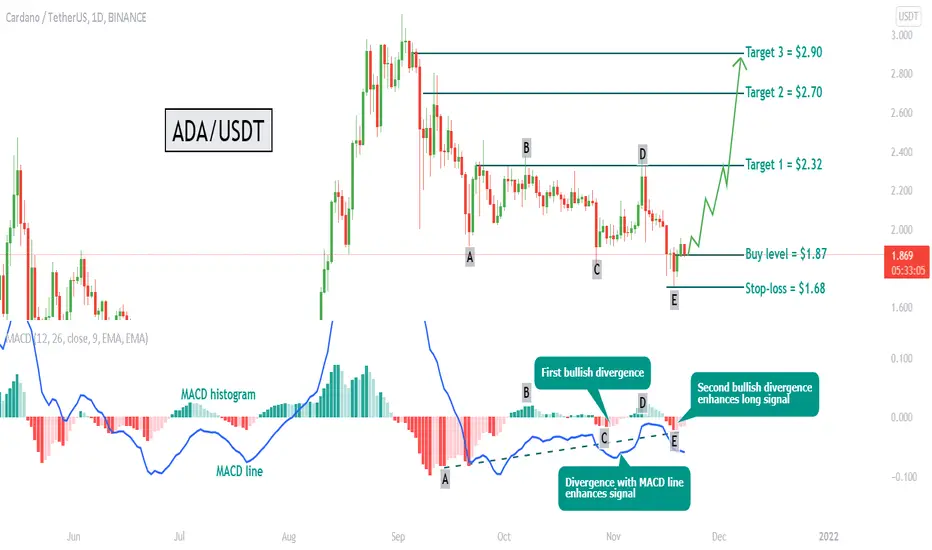
We can see on the pic that the point A is above than C on the price chart, while A is below C on the MACD lines. There was the bullish divergence at the point C. This signal played out as the pump to the point D, but the price set new lower low at point E. Point E is above than A at the MACD histogram. This triple divergence enhances the bullish signal for ADA. Moreover there is also the divergence with MACD line, this fact makes this signal even stronger. Thus I can provide for you the following trade setup:
Buy = $1.87
Stop-loss= $1.68
Target 1= $2.32
Target 2 = $2.70
Target 3= $2.90
DISCLAMER: Information is provided only for educational purposes. Do your own study before taking any actions or decisions at the real market.
Yesterday we considered the ultimate divergences guide. Today it is time to practice! I found the very strong long signal on Cardano.
We can see on the pic that the point A is above than C on the price chart, while A is below C on the MACD lines. There was the bullish divergence at the point C. This signal played out as the pump to the point D, but the price set new lower low at point E. Point E is above than A at the MACD histogram. This triple divergence enhances the bullish signal for ADA. Moreover there is also the divergence with MACD line, this fact makes this signal even stronger. Thus I can provide for you the following trade setup:
Buy = $1.87
Stop-loss= $1.68
Target 1= $2.32
Target 2 = $2.70
Target 3= $2.90
DISCLAMER: Information is provided only for educational purposes. Do your own study before taking any actions or decisions at the real market.
トレード稼働中
Stop-loss was hit by the price but on the daily chart I want to see the candle close below stop-loss to close the position. The divergence is still actual and even if the price will go below stop-loss, we will re-enter the position again. トレード終了: ストップロスに到達
Stop loss level was reached. We are waiting for the new reversal signal.トレード稼働中
Hello, everyone!Last time I unsuccessfully entered long position in Cardano, I made the analysis here. But the price hit my stop-loss level. I am not going to give up and found the new strong buy signal for ADA.
I told you that if you trade divergences, you should be able to exit and re-enter position if the new divergence forms. Now it is the case! If today’s MACD histogram column close decreasing in comparison with previous, this is the long signal. Moreover ADA is on the zone of interest, it is too stupid not to use this opportunity. The potential profit will cover our loss at least 3 times. Targets and stop-loss you can find on the chart.

Turn TradingView indicator & strategy alerts into automated trades on major crypto exchanges using no-code bots
Start free at skyrexio.com
Start free at skyrexio.com
関連の投稿
免責事項
これらの情報および投稿は、TradingViewが提供または承認する金融、投資、取引、またはその他の種類の助言もしくは推奨であることを意図したものではなく、またこれらに該当するものでもありません。詳細は利用規約をご覧ください。
Turn TradingView indicator & strategy alerts into automated trades on major crypto exchanges using no-code bots
Start free at skyrexio.com
Start free at skyrexio.com
関連の投稿
免責事項
これらの情報および投稿は、TradingViewが提供または承認する金融、投資、取引、またはその他の種類の助言もしくは推奨であることを意図したものではなく、またこれらに該当するものでもありません。詳細は利用規約をご覧ください。