
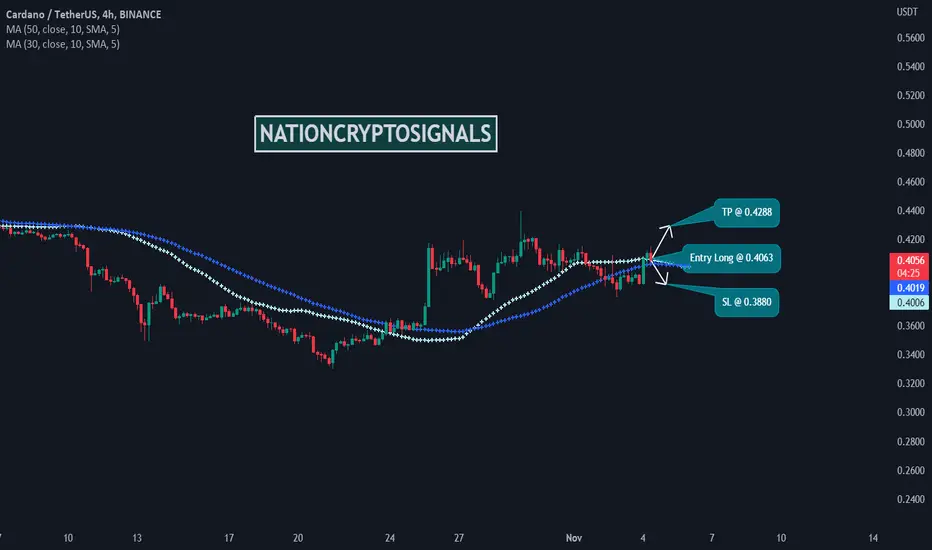
Time Frame: 4H
Symbol: ADAUSDT
Entry: 0.4063
TP: 0.4288
SL: 0.3880
Bias: Long
The study of dynamic support and resistance displays a narrow range and the price is oscillating between two extremes but the volatility factor is low. That is why we cannot expect a high potential trade from the current price context. Considering the price pattern we can expect some price move from support to resistance and resistance to support.

免責事項
これらの情報および投稿は、TradingViewが提供または承認する金融、投資、取引、またはその他の種類の助言もしくは推奨であることを意図したものではなく、またこれらに該当するものでもありません。詳細は利用規約をご覧ください。
免責事項
これらの情報および投稿は、TradingViewが提供または承認する金融、投資、取引、またはその他の種類の助言もしくは推奨であることを意図したものではなく、またこれらに該当するものでもありません。詳細は利用規約をご覧ください。