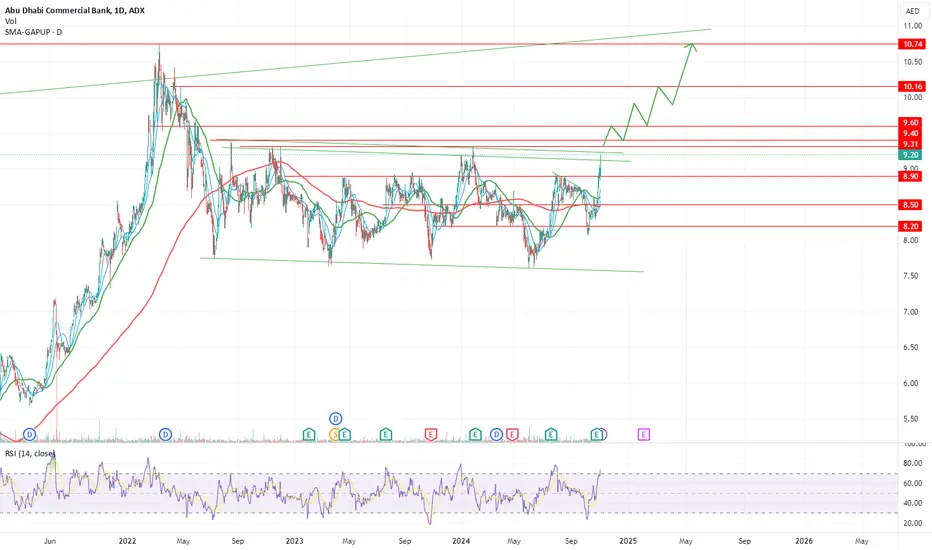
 ADCB chart is amazing! More than two years of consolidation and now the stock seems to be ready to move forward. This is a long term buy and targets are higher than the levels shown on the chart, the anticipated price movement shown on the chart should unfold in the coming 6 to 12 months if the stock breaks above the level 9.31~9.4 AED. Stoploss daily close below 8.8 AED.
 トレード終了: 利益確定目標に到達

免責事項
これらの情報および投稿は、TradingViewが提供または承認する金融、投資、取引、またはその他の種類の助言もしくは推奨であることを意図したものではなく、またこれらに該当するものでもありません。詳細は利用規約をご覧ください。
免責事項
これらの情報および投稿は、TradingViewが提供または承認する金融、投資、取引、またはその他の種類の助言もしくは推奨であることを意図したものではなく、またこれらに該当するものでもありません。詳細は利用規約をご覧ください。