ショート
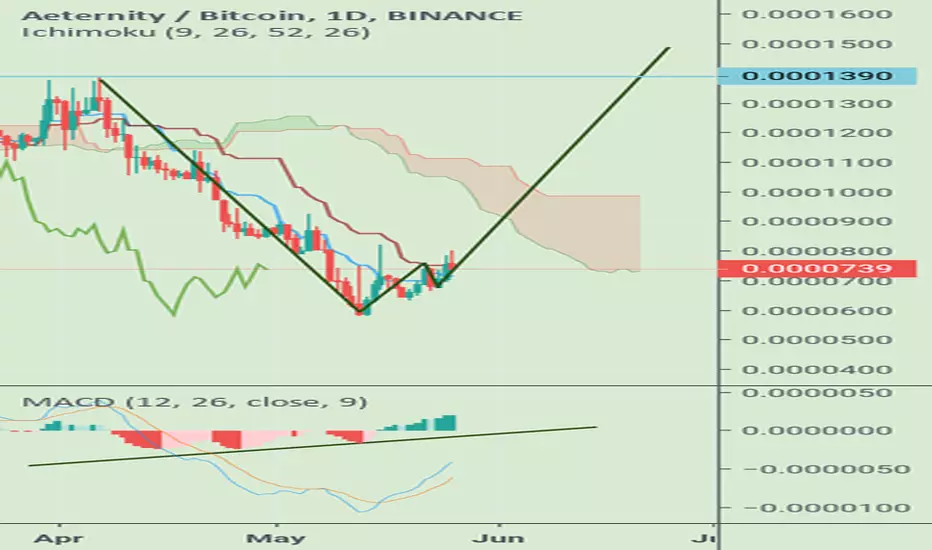
AE/BTC 1D
Hello friends
We are here AE/BTC charts see
1.In the daily chart after 49 days opens candel top of the "Tenkan sen" line on ichimuko indicator ; this means the break resistance short term
2.buliesh divergens in macd indicator
3.nice double bottom pattern in this chart
So i think in short time we see 1500sat but in 1390sat area we have big resistance
I hope this analysis be useful to you. Definitely a financial advice is not

免責事項
これらの情報および投稿は、TradingViewが提供または承認する金融、投資、取引、またはその他の種類の助言もしくは推奨であることを意図したものではなく、またこれらに該当するものでもありません。詳細は利用規約をご覧ください。
免責事項
これらの情報および投稿は、TradingViewが提供または承認する金融、投資、取引、またはその他の種類の助言もしくは推奨であることを意図したものではなく、またこれらに該当するものでもありません。詳細は利用規約をご覧ください。