
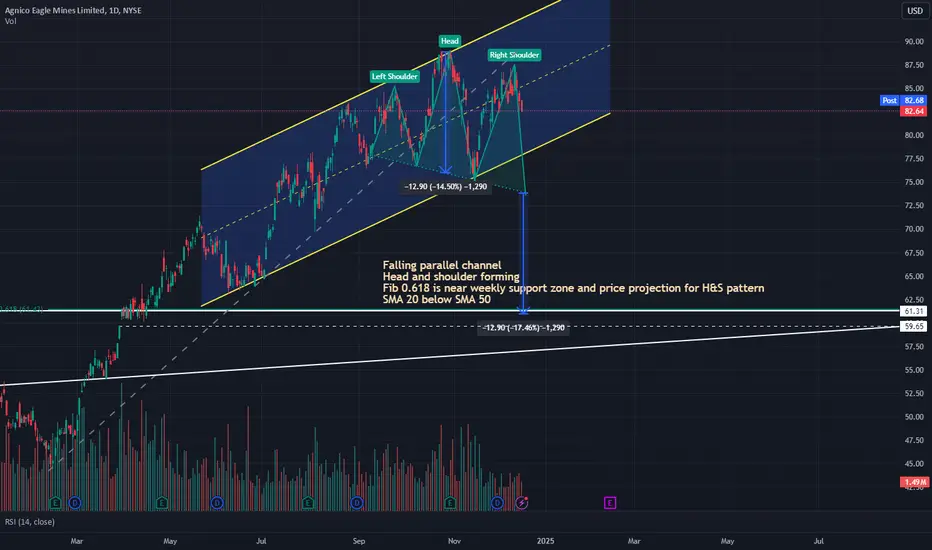
AEM is possibly forming a Head & Shoulder pattern.
Price action is currently under a rising parallel channel that breaks downwards and price eventually breaks parallel channel. If price breaks the parallel channel and $74, it will complete Head & Shoulder pattern.
Once Head & Shoulder pattern is formed, stock price fall is either $ price or percentage difference between Head and neckline. In this case, the projected price fall after completion of Head & Shoulder is likely to be between:
- 63.17 if price drops by 14.50%
- 60.98 if price drops by $12.90
Price is probable to fall by $12.90 to 60.98 because it coincides with:
- Fib retracement level of 0.618 which is a golden ratio
- strong weekly support zone around 61.31
- gap fill is at 59.65
トレード終了: ストップロスに到達
Price closed above the neckline so head and shoulder pattern is negated and no longer valid
免責事項
これらの情報および投稿は、TradingViewが提供または承認する金融、投資、取引、またはその他の種類の助言もしくは推奨であることを意図したものではなく、またこれらに該当するものでもありません。詳細は利用規約をご覧ください。
免責事項
これらの情報および投稿は、TradingViewが提供または承認する金融、投資、取引、またはその他の種類の助言もしくは推奨であることを意図したものではなく、またこれらに該当するものでもありません。詳細は利用規約をご覧ください。