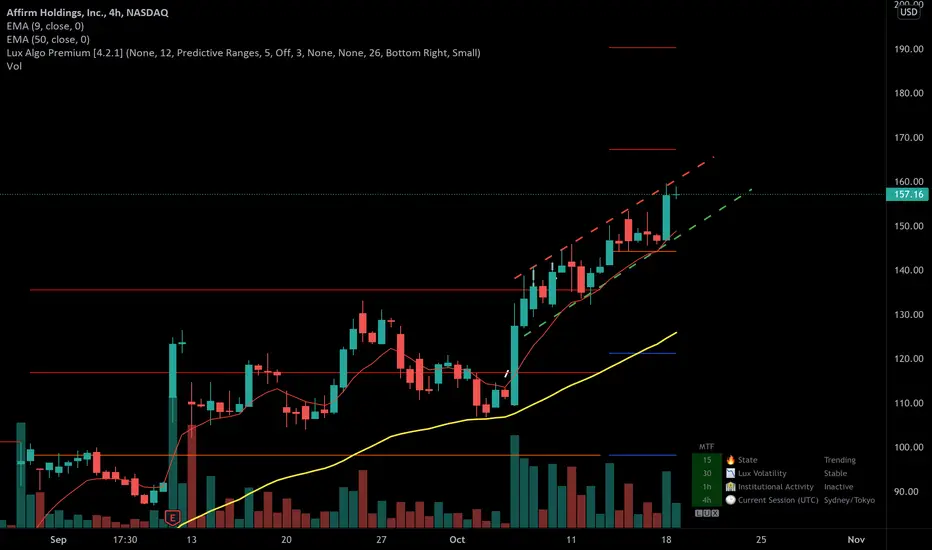
We are in this channel since Oct 6, a doji candle was form in the 4H chart so we can experience a minimal pullback in the following days to the support line. Overall we are in a uptrend and we also broke last ATH at 146. I'm looking to add long positions at 150-151 or after breakout of the resistance line in this channel.
The horizontal lines are standard deviation. The yellow line is the mean and is acting as support right now. I'm not a financial advisor and this is my personal opinion. Have a great trading week! AFRM
AFRM
The horizontal lines are standard deviation. The yellow line is the mean and is acting as support right now. I'm not a financial advisor and this is my personal opinion. Have a great trading week!
AFRM
免責事項
これらの情報および投稿は、TradingViewが提供または承認する金融、投資、取引、またはその他の種類の助言もしくは推奨であることを意図したものではなく、またこれらに該当するものでもありません。詳細は利用規約をご覧ください。
免責事項
これらの情報および投稿は、TradingViewが提供または承認する金融、投資、取引、またはその他の種類の助言もしくは推奨であることを意図したものではなく、またこれらに該当するものでもありません。詳細は利用規約をご覧ください。