
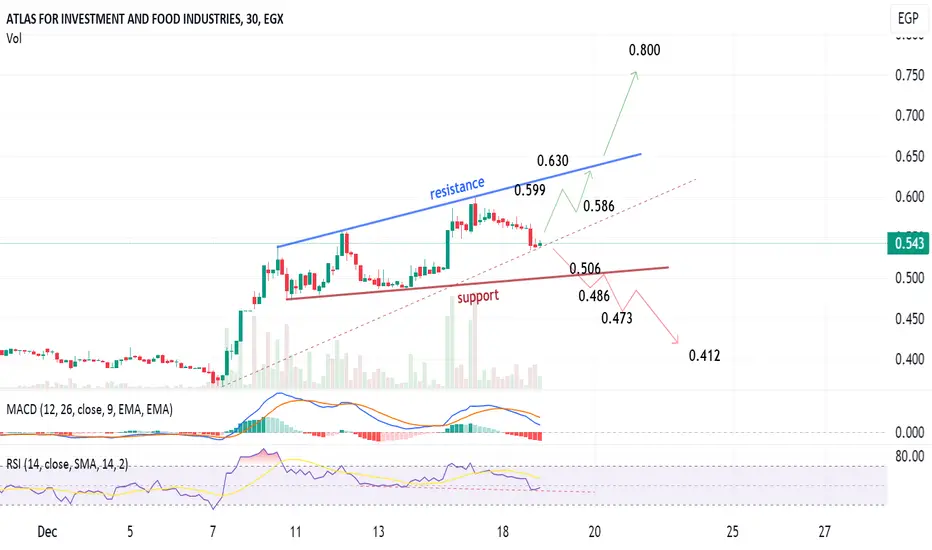
30-min chart, AIFI is trading in a critical level, where it can rebound from the current level to test resistance (BLUE), or go downwards to test the support line (RED)
My view is more positive (upwards)..
Some important price levels of resistance and support are shown on the chart for monitoring.
Above resistance: target 0.800
Below support: target 0.412
My view is more positive (upwards)..
Some important price levels of resistance and support are shown on the chart for monitoring.
Above resistance: target 0.800
Below support: target 0.412
トレード終了: ストップロスに到達

関連の投稿
免責事項
これらの情報および投稿は、TradingViewが提供または承認する金融、投資、取引、またはその他の種類の助言もしくは推奨であることを意図したものではなく、またこれらに該当するものでもありません。詳細は利用規約をご覧ください。
免責事項
これらの情報および投稿は、TradingViewが提供または承認する金融、投資、取引、またはその他の種類の助言もしくは推奨であることを意図したものではなく、またこれらに該当するものでもありません。詳細は利用規約をご覧ください。