
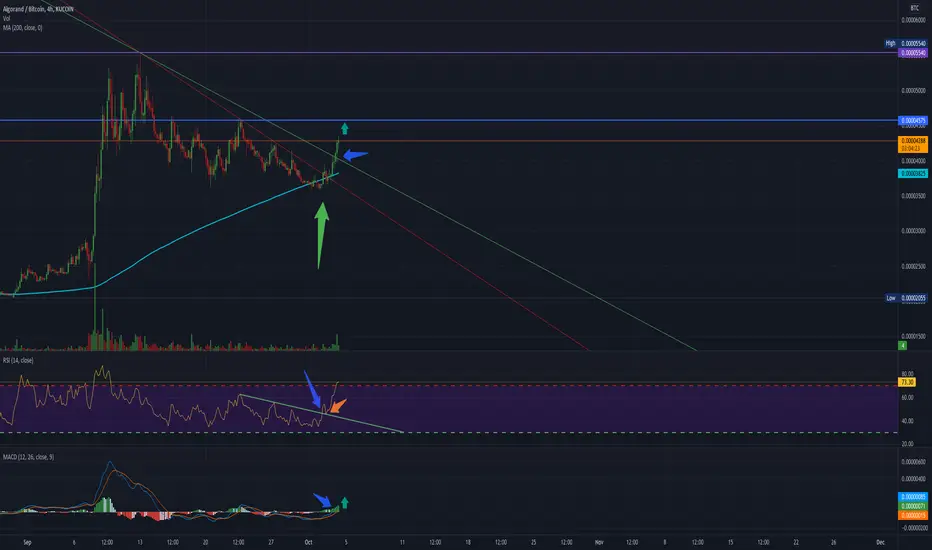
Here is a quick analysis of the ALGO/BTC chart pumping.
Next targets are resistances marked in horizontal ray blue at 4575 sats & purple at 5540 sats per ALGO coin.
Big green arrow shows how the trend tested the 200 MA and bounced off of it making to break the downtrend channel that was created.
RSI indicator shows how once the downtrend was broken (blue small arrow), it backtested before mooning (orange small arrow).
MACD Showing how positive momentum is building up... :)
ノート
LOLOLOLOL
免責事項
これらの情報および投稿は、TradingViewが提供または承認する金融、投資、取引、またはその他の種類の助言もしくは推奨であることを意図したものではなく、またこれらに該当するものでもありません。詳細は利用規約をご覧ください。
免責事項
これらの情報および投稿は、TradingViewが提供または承認する金融、投資、取引、またはその他の種類の助言もしくは推奨であることを意図したものではなく、またこれらに該当するものでもありません。詳細は利用規約をご覧ください。