
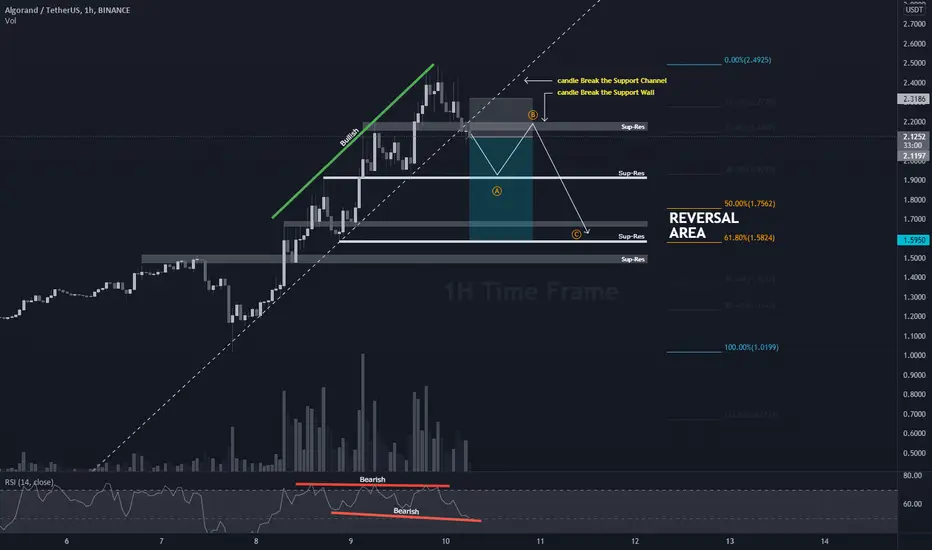
Reason:
1. Break the support Channel
2. Break the support Wall
3. Break the EMA support in 30M Time Frame
4. RSI Divergence
5. I think wave 5 is over
For the stop loss level consider the trendline and the EMA as a new resistance
The corrective path just a illustration about the ABC corrective wave, it can be flat or zigzag or another ABC
Disclaimer ON
this chart is not a signal you should follow, I just want to share what I think, if I made a mistake please let me know in the comments section, Thanks.
Break the EMA support in 30M Time Frame

1. Break the support Channel
2. Break the support Wall
3. Break the EMA support in 30M Time Frame
4. RSI Divergence
5. I think wave 5 is over
For the stop loss level consider the trendline and the EMA as a new resistance
The corrective path just a illustration about the ABC corrective wave, it can be flat or zigzag or another ABC
Disclaimer ON
this chart is not a signal you should follow, I just want to share what I think, if I made a mistake please let me know in the comments section, Thanks.
Break the EMA support in 30M Time Frame
トレード稼働中
you can entry short when candle retest!
トレード稼働中
another way using chart pattern, how about this guys?? look the relationship with the fibonaci, 76.4%, for me its still make sense LOL

免責事項
これらの情報および投稿は、TradingViewが提供または承認する金融、投資、取引、またはその他の種類の助言もしくは推奨であることを意図したものではなく、またこれらに該当するものでもありません。詳細は利用規約をご覧ください。
免責事項
これらの情報および投稿は、TradingViewが提供または承認する金融、投資、取引、またはその他の種類の助言もしくは推奨であることを意図したものではなく、またこれらに該当するものでもありません。詳細は利用規約をご覧ください。