
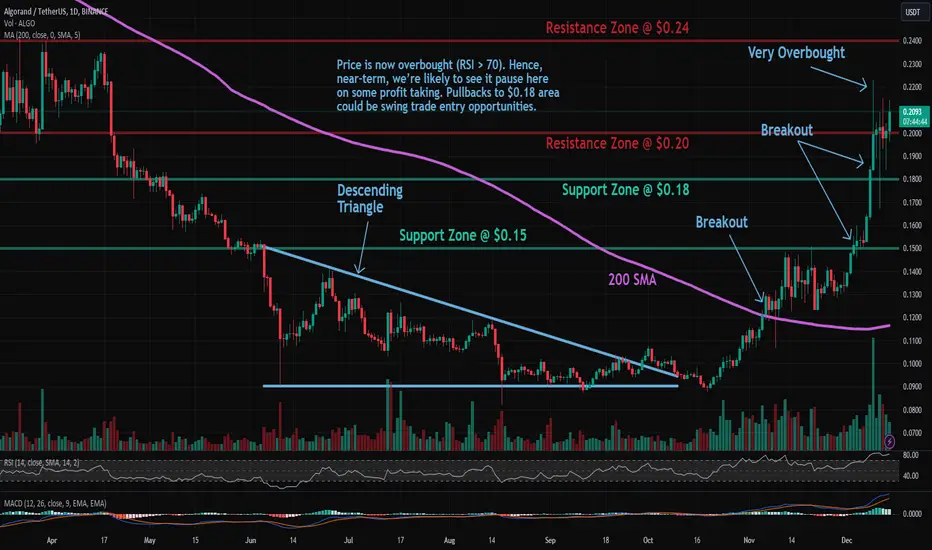
Trade setup: After getting rejected at $0.15 resistance a few times in November, price has finally broken above it to signal continuation of uptrend with upside potential to $0.24. However, price is now overbought (RSI > 70), hence, near-term, we’re likely to see it pause here on some profit taking.
Pullbacks to $0.18 area could be swing trade entry opportunities. Previously, price broke above above 200-day moving average, which confirmed a bullish trend reversal to an Uptrend.
Trend: Uptrend across all time horizons (Short- Medium- and Long-Term).
Momentum is Bullish but inflecting. MACD Line is above MACD Signal Line and RSI is above 55 but momentum may have peaked since MACD Histogram bars are declining, which suggests that momentum is weakening.
Support and Resistance: Nearest Support Zone is $0.18 (previous resistance), then $0.15. The nearest Resistance Zone is $0.20, then $0.24.
Pullbacks to $0.18 area could be swing trade entry opportunities. Previously, price broke above above 200-day moving average, which confirmed a bullish trend reversal to an Uptrend.
Trend: Uptrend across all time horizons (Short- Medium- and Long-Term).
Momentum is Bullish but inflecting. MACD Line is above MACD Signal Line and RSI is above 55 but momentum may have peaked since MACD Histogram bars are declining, which suggests that momentum is weakening.
Support and Resistance: Nearest Support Zone is $0.18 (previous resistance), then $0.15. The nearest Resistance Zone is $0.20, then $0.24.

免責事項
これらの情報および投稿は、TradingViewが提供または承認する金融、投資、取引、またはその他の種類の助言もしくは推奨であることを意図したものではなく、またこれらに該当するものでもありません。詳細は利用規約をご覧ください。
免責事項
これらの情報および投稿は、TradingViewが提供または承認する金融、投資、取引、またはその他の種類の助言もしくは推奨であることを意図したものではなく、またこれらに該当するものでもありません。詳細は利用規約をご覧ください。