
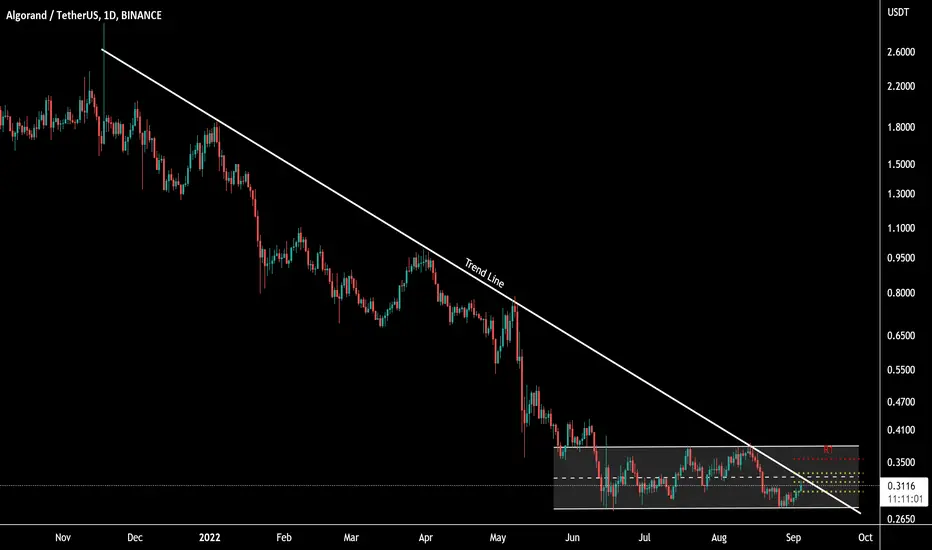
(Trend Line)
As the name implies, trend lines are levels used in technical analysis that can be drawn along a trend to represent either support or resistance, depending on the direction of the trend. Think of them as the diagonal equivalent of horizontal support and resistance.
Notice how shortly after breaking trend line resistance, the market came back to retest the trend line as new support and formed a bullish pin bar in the process.
This allowed price action traders to buy just before the market rallied for up trend

免責事項
これらの情報および投稿は、TradingViewが提供または承認する金融、投資、取引、またはその他の種類の助言もしくは推奨であることを意図したものではなく、またこれらに該当するものでもありません。詳細は利用規約をご覧ください。
免責事項
これらの情報および投稿は、TradingViewが提供または承認する金融、投資、取引、またはその他の種類の助言もしくは推奨であることを意図したものではなく、またこれらに該当するものでもありません。詳細は利用規約をご覧ください。