
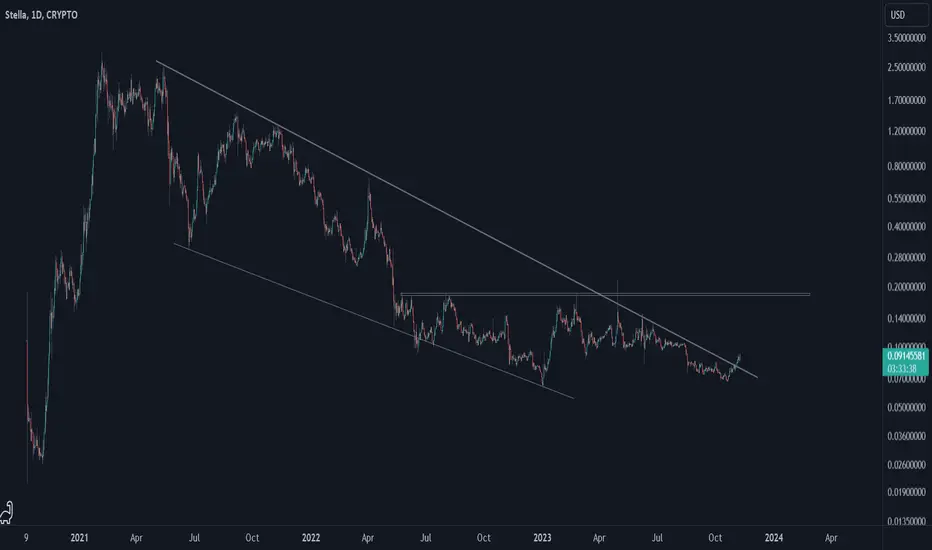
Stella's chart is straightforward; a sharp upward move followed by a lengthy correction wave unfolded in a big descending triangle pattern. Recently, ALPHA broke the major downtrend line. Let's see how up Stella can go.
ノート
Alpha is going crazy!
ノート
So, after Alpha frenzy ended, price came down. Alpha need to break this major horizontal resistance area in order to confirm reversal. Let's see what happens.
ノート
So, Alpha couldn't break the major horizontal resistance area, then went down. It seems Alpha has made an inverted wedge/triangle pattern. Recently, Alpha reached the bottom and then broke the downtrend line. Let's see if Alpha can reach the inverted pattern's top or even break it.
トレード稼働中
So, Alpha is going up toward the inverted wedge's upper line. Let's see what happens.

免責事項
これらの情報および投稿は、TradingViewが提供または承認する金融、投資、取引、またはその他の種類の助言もしくは推奨であることを意図したものではなく、またこれらに該当するものでもありません。詳細は利用規約をご覧ください。
免責事項
これらの情報および投稿は、TradingViewが提供または承認する金融、投資、取引、またはその他の種類の助言もしくは推奨であることを意図したものではなく、またこれらに該当するものでもありません。詳細は利用規約をご覧ください。