
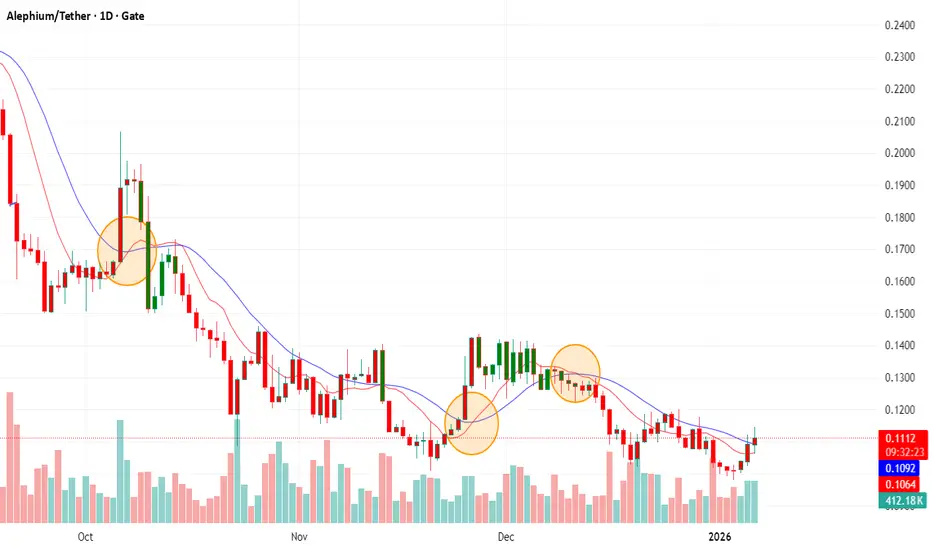
On the Daily chart, the exponential and simple moving average crosses marked with an orange circle highlights a high-probability (HP) reaction zone rather than an immediate trend reversal. Each crossover occurred after short-term price expansion as clearly indicated, followed by visible rejection, confirming the broader bearish structure.
The EMA, being more responsive, crossed the slower moving average during brief relief rallies as clearly indicated, but a lack of follow-through volume led to failure and a lower continuation pattern.
These HP crosses acted as dynamic resistance, aligning with lower highs and reinforcing seller control. Notably, price consistently closed below the crossed averages soon after, validating the signal. In this context, EMA–MA crosses are best treated as confirmation tools, not standalone entries, favoring patience and confluence with structure, volume, and key support–resistance levels.
Absolutely phenomenal!
The EMA, being more responsive, crossed the slower moving average during brief relief rallies as clearly indicated, but a lack of follow-through volume led to failure and a lower continuation pattern.
These HP crosses acted as dynamic resistance, aligning with lower highs and reinforcing seller control. Notably, price consistently closed below the crossed averages soon after, validating the signal. In this context, EMA–MA crosses are best treated as confirmation tools, not standalone entries, favoring patience and confluence with structure, volume, and key support–resistance levels.
Absolutely phenomenal!

免責事項
これらの情報および投稿は、TradingViewが提供または承認する金融、投資、取引、またはその他の種類の助言もしくは推奨であることを意図したものではなく、またこれらに該当するものでもありません。詳細は利用規約をご覧ください。
免責事項
これらの情報および投稿は、TradingViewが提供または承認する金融、投資、取引、またはその他の種類の助言もしくは推奨であることを意図したものではなく、またこれらに該当するものでもありません。詳細は利用規約をご覧ください。