AMB BTC all about - binance
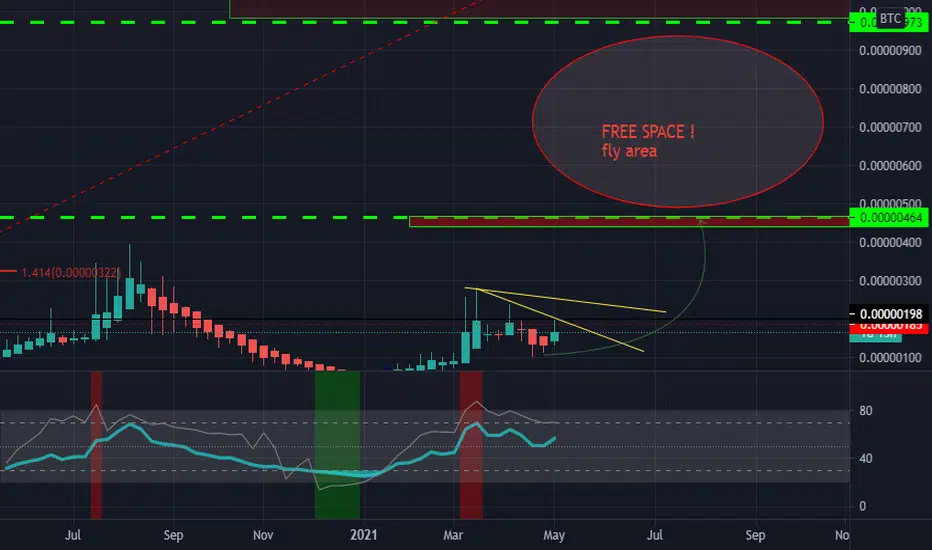
this 2 yellow line will break easy and soon if we take a look at weekly chart .
so what happening after that :
targets will be gap.
for example after 500 sat. until next resistance there is huge gap.
this possibility is not far from the mind due to the good condition of the weekly chart!
I want to be as optimistic about this as I was about a few months ago. (When it was 40 Satoshi).
and for short 440 - 500 sat can be target.
so what happening after that :
targets will be gap.
for example after 500 sat. until next resistance there is huge gap.
this possibility is not far from the mind due to the good condition of the weekly chart!
I want to be as optimistic about this as I was about a few months ago. (When it was 40 Satoshi).
and for short 440 - 500 sat can be target.

関連の投稿
免責事項
これらの情報および投稿は、TradingViewが提供または承認する金融、投資、取引、またはその他の種類の助言もしくは推奨であることを意図したものではなく、またこれらに該当するものでもありません。詳細は利用規約をご覧ください。
免責事項
これらの情報および投稿は、TradingViewが提供または承認する金融、投資、取引、またはその他の種類の助言もしくは推奨であることを意図したものではなく、またこれらに該当するものでもありません。詳細は利用規約をご覧ください。