
AMD: A Multi-Decade Ceiling Is Turning Into a Breakout Test
This is one of the cleaner long-term equity structures I am watching.
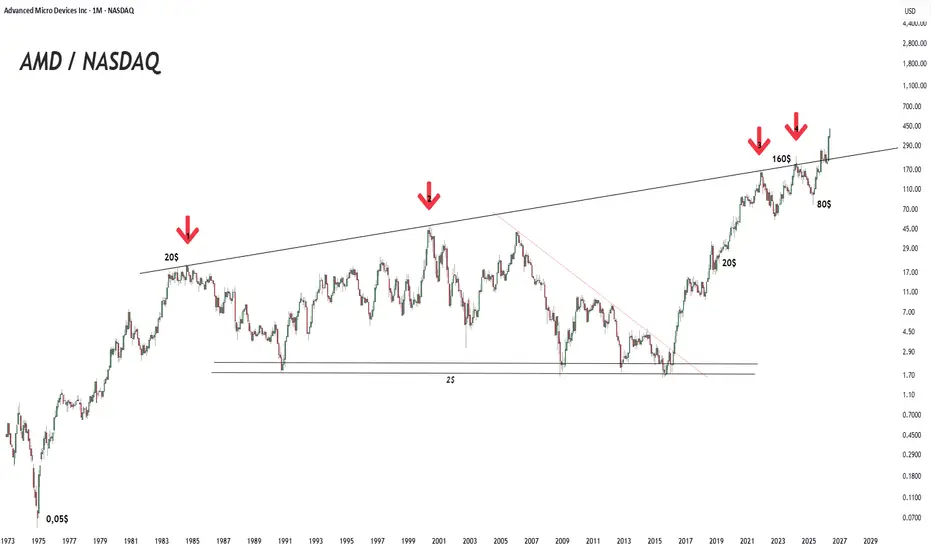
The chart is AMD on a monthly logarithmic scale.
The important part is not only that AMD has moved higher.
The important part is where it is moving from, and what it is trying to break.
For decades, AMD has respected a rising long-term upper boundary.
That same structure marked multiple major cycle excess zones:
The 1980s top around the 20$ region.
The 2000 cycle top.
The 2021 cycle top around the 160$ region.
And the latest major test before the current breakout attempt.
That is not random.
The market has repeatedly used the same long-term log resistance as AMD’s cycle ceiling.
This is why the current setup matters.
AMD is no longer only touching that ceiling.
It is trying to move above it.
That is a very different technical message.
In the past, this upper line acted as exhaustion.
Now the question is whether it can become acceptance.
If AMD can hold above the old multi-decade ceiling, the chart starts to shift from “cycle resistance” into a potential new secular repricing regime.
That is the key point.
The lower structure also matters.
The 2$ area acted as a deep secular floor across multiple historical phases.
The 20$ area was once a major cycle top, then later became the gateway into the next expansion.
The 80$ region became the latest important higher low.
The 160$ region was the 2021 cycle-top zone, but AMD has now moved far beyond it again.

That sequence is technically constructive.
It shows that the 2021 top did not become a permanent ceiling.
Instead, AMD corrected, defended a much higher base, reclaimed the old top zone, and is now attacking the long-term upper boundary.
That is exactly how secular leaders behave when they are trying to reprice into a higher regime.
The most important current zone is the old upper trendline, roughly around the 270$-300$ region.
If AMD stays above that area on monthly structure, the breakout becomes much more meaningful.
In that case, the old ceiling may become the new structural floor.
That would be a major technical shift.
The bullish case is simple:
AMD holds above the old multi-decade resistance.
It builds higher lows above that zone.
It continues accepting price above the previous cycle ceiling.
If that happens, the chart supports the idea that AMD is entering a new secular expansion phase.
AMD pulls back toward the breakout zone and spends time consolidating above it.
That would not be bearish.
A retest of a multi-decade breakout area can be healthy, especially after such a strong move.
AMD falls back below the old upper boundary and fails to reclaim it.
That would turn the breakout attempt into a failed acceptance test.
The major invalidation is lower.
If AMD loses the 80$ higher-low region, the entire higher-base structure weakens.
But that is not what the chart is showing right now.
Right now, the message is more constructive:
AMD has reclaimed the 160$ cycle-top zone.
It has defended a higher base around 80$.
It is now pushing above a resistance line that capped multiple historical cycle peaks.
That is a powerful technical sequence.
My read:
This is not just a stock making another high.
This is a multi-decade structure trying to change character.
Old cycle ceiling.
New acceptance test.
If the breakout holds, AMD’s long-term chart begins to look like a secular repricing structure rather than a simple late-cycle extension.
No hype.
Just a very clean technical map.
This is one of the cleaner long-term equity structures I am watching.
The chart is AMD on a monthly logarithmic scale.
The important part is not only that AMD has moved higher.
The important part is where it is moving from, and what it is trying to break.
For decades, AMD has respected a rising long-term upper boundary.
That same structure marked multiple major cycle excess zones:
The 1980s top around the 20$ region.
The 2000 cycle top.
The 2021 cycle top around the 160$ region.
And the latest major test before the current breakout attempt.
That is not random.
The market has repeatedly used the same long-term log resistance as AMD’s cycle ceiling.
This is why the current setup matters.
AMD is no longer only touching that ceiling.
It is trying to move above it.
That is a very different technical message.
In the past, this upper line acted as exhaustion.
Now the question is whether it can become acceptance.
If AMD can hold above the old multi-decade ceiling, the chart starts to shift from “cycle resistance” into a potential new secular repricing regime.
That is the key point.
The lower structure also matters.
The 2$ area acted as a deep secular floor across multiple historical phases.
The 20$ area was once a major cycle top, then later became the gateway into the next expansion.
The 80$ region became the latest important higher low.
The 160$ region was the 2021 cycle-top zone, but AMD has now moved far beyond it again.
That sequence is technically constructive.
It shows that the 2021 top did not become a permanent ceiling.
Instead, AMD corrected, defended a much higher base, reclaimed the old top zone, and is now attacking the long-term upper boundary.
That is exactly how secular leaders behave when they are trying to reprice into a higher regime.
The most important current zone is the old upper trendline, roughly around the 270$-300$ region.
If AMD stays above that area on monthly structure, the breakout becomes much more meaningful.
In that case, the old ceiling may become the new structural floor.
That would be a major technical shift.
The bullish case is simple:
AMD holds above the old multi-decade resistance.
It builds higher lows above that zone.
It continues accepting price above the previous cycle ceiling.
If that happens, the chart supports the idea that AMD is entering a new secular expansion phase.
AMD pulls back toward the breakout zone and spends time consolidating above it.
That would not be bearish.
A retest of a multi-decade breakout area can be healthy, especially after such a strong move.
AMD falls back below the old upper boundary and fails to reclaim it.
That would turn the breakout attempt into a failed acceptance test.
The major invalidation is lower.
If AMD loses the 80$ higher-low region, the entire higher-base structure weakens.
But that is not what the chart is showing right now.
Right now, the message is more constructive:
AMD has reclaimed the 160$ cycle-top zone.
It has defended a higher base around 80$.
It is now pushing above a resistance line that capped multiple historical cycle peaks.
That is a powerful technical sequence.
My read:
This is not just a stock making another high.
This is a multi-decade structure trying to change character.
Old cycle ceiling.
New acceptance test.
If the breakout holds, AMD’s long-term chart begins to look like a secular repricing structure rather than a simple late-cycle extension.
No hype.
Just a very clean technical map.

Crypto Cycles | Fractals | Onchain | Macro | Market Psychology
Charts here. Daily cycle research on x.com/Cryptollica
Charts here. Daily cycle research on x.com/Cryptollica
免責事項
これらの情報および投稿は、TradingViewが提供または承認する金融、投資、取引、またはその他の種類の助言もしくは推奨であることを意図したものではなく、またこれらに該当するものでもありません。詳細は利用規約をご覧ください。
Crypto Cycles | Fractals | Onchain | Macro | Market Psychology
Charts here. Daily cycle research on x.com/Cryptollica
Charts here. Daily cycle research on x.com/Cryptollica
免責事項
これらの情報および投稿は、TradingViewが提供または承認する金融、投資、取引、またはその他の種類の助言もしくは推奨であることを意図したものではなく、またこれらに該当するものでもありません。詳細は利用規約をご覧ください。