
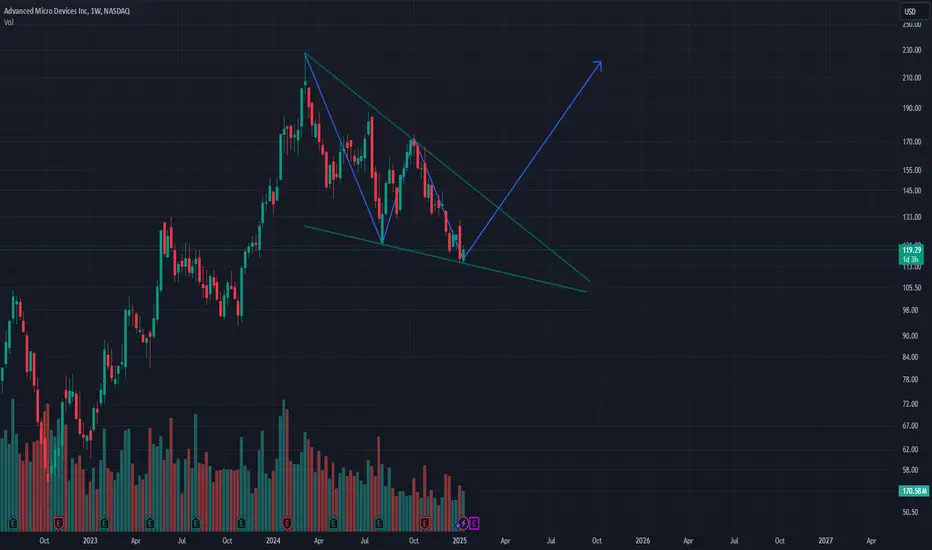
AMD is forming a clear falling wedge pattern, a powerful bullish reversal setup. The stock has been making lower highs and lower lows within converging trendlines, suggesting accumulation and potential breakout. The pattern suggests strong accumulation phase and the breakout could trigger significant upside momentum.
Key Technical Points:
Clear falling wedge formation with converging trendlines
Declining volume indicating potential trend exhaustion
Entry Point: Current price level
Stop Loss: $100 (key support level)
Target: $200 (psychological resistance)
Risk/Reward ratio is favorable at 1:4, with $80 potential profit against $20 risk.

免責事項
これらの情報および投稿は、TradingViewが提供または承認する金融、投資、取引、またはその他の種類の助言もしくは推奨であることを意図したものではなく、またこれらに該当するものでもありません。詳細は利用規約をご覧ください。
免責事項
これらの情報および投稿は、TradingViewが提供または承認する金融、投資、取引、またはその他の種類の助言もしくは推奨であることを意図したものではなく、またこれらに該当するものでもありません。詳細は利用規約をご覧ください。