
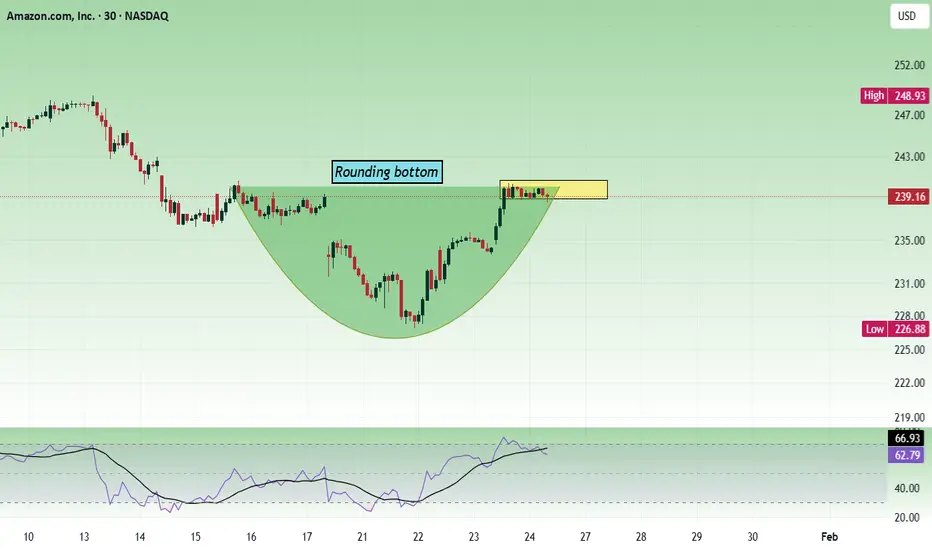
Patterns seen in the chart are
1. Rounding bottom - bullish pattern(it can form a handle)
2. Consolidation zone - neutral, break-out can happen in any direction.
Buy above 240 with the stop loss of 238.5 for the targets 241.5, 243, 245 and 247. Resistance is seen at the 247 - 248 zone.
Sell below 236 with the stop loss of 238 for the targets 234.5, 232, 230 and 228.
Always do your analysis before taking any trade.
トレード稼働中
Long. T3 done. 
Role I play here : Moderator. Follow me in telegram to trade better. t.me/Analysis4Newbie Contact information : tradingplan4u@gmail.com
免責事項
これらの情報および投稿は、TradingViewが提供または承認する金融、投資、取引、またはその他の種類の助言もしくは推奨であることを意図したものではなく、またこれらに該当するものでもありません。詳細は利用規約をご覧ください。
Role I play here : Moderator. Follow me in telegram to trade better. t.me/Analysis4Newbie Contact information : tradingplan4u@gmail.com
免責事項
これらの情報および投稿は、TradingViewが提供または承認する金融、投資、取引、またはその他の種類の助言もしくは推奨であることを意図したものではなく、またこれらに該当するものでもありません。詳細は利用規約をご覧ください。