
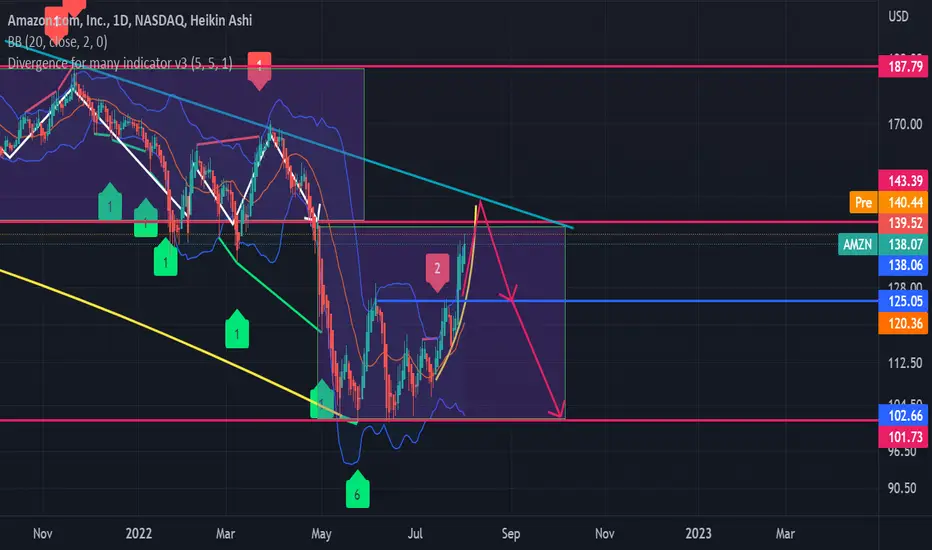
Amazon was marked with a huge growth during the COVID period which makes us focus on the behaviour of the stock within the rectangle of that period. And we notice here that we have a support at 143 and within the rectangle we can notice the oscillation of the price. This also marks a curve format that leads us to the downtrend starting from April 2022.
So, following the trend line above we expect that the price will first rise following the curve in the rectangle then drops either to 124 or 101 which is the limit of the rectangle.
So, following the trend line above we expect that the price will first rise following the curve in the rectangle then drops either to 124 or 101 which is the limit of the rectangle.
ノート
The price got rejected at the resistance as we expected.The trend should continue down and reach the target in a few weeks. Patience is a key

💥 Free signals and ideas ➡ t.me/vfinvestment
免責事項
これらの情報および投稿は、TradingViewが提供または承認する金融、投資、取引、またはその他の種類の助言もしくは推奨であることを意図したものではなく、またこれらに該当するものでもありません。詳細は利用規約をご覧ください。
💥 Free signals and ideas ➡ t.me/vfinvestment
免責事項
これらの情報および投稿は、TradingViewが提供または承認する金融、投資、取引、またはその他の種類の助言もしくは推奨であることを意図したものではなく、またこれらに該当するものでもありません。詳細は利用規約をご覧ください。